Descripción
Descripción
Indicadores de Pinescriptlabs Store: 🤖 Pinescriptlabs Store cBots : (cBot)
Gold & BTC BreakoutSession Pivots(nuevo)
SmartTrend Soporte y
Resistencia
Líneas
Sesiones de Brecha de Valor Justo
Análisis
Dinámico de la Estructura
del Mercado
de
Puntos de Giro
Regresión
Lineal de Fibonacci
Multi-temporal
Multi-temporal
Brecha de Valor Justo de Momentum
Proyección del Flujo del Mercado
Gradiente de Tendencia Dinámico
Sesgo de Vela
Multi-Nivel
Rastreador
Rastreador de Extremos Zig-Zag
Soporte
y Resistencia
Automáticos
Líneas de Tendencia
Líneas
Todos
los Niveles de
Soporte y Resistencia
Niveles
Mapa de Liquidación por Apalancamiento
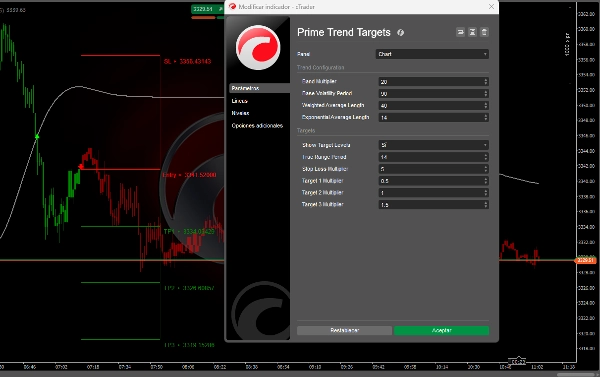
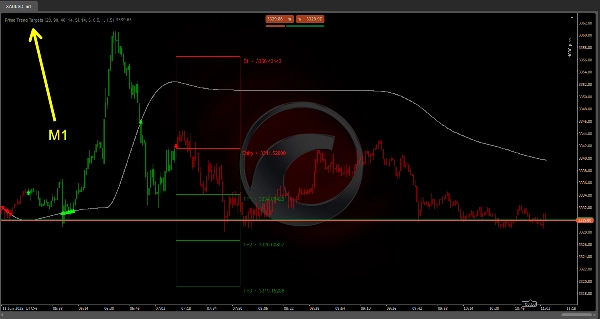
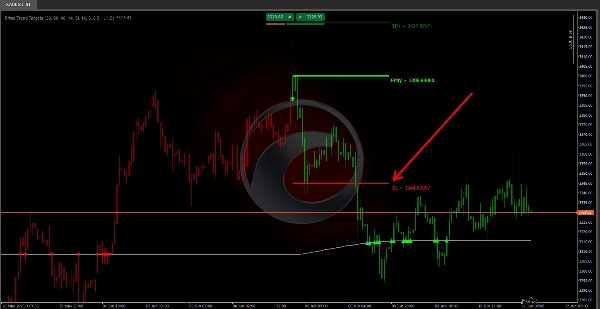
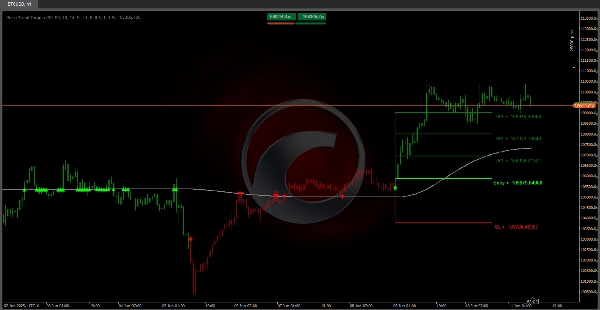
Objetivos Principales de Tendencia :
ofrece una línea de tendencia suavizada basada en bandas de volatilidad (ATR) con lógica de persistencia, filtrando el ruido menor. 🔄 Detecta reversiones de tendencia comparando el valor actual de la línea con el anterior y valida señales mediante un conteo de rechazo cuando el precio prueba repetidamente la línea. ✅ Una vez confirmada una fase de cambio, proyecta entrada, stop loss y hasta tres objetivos ajustados por volatilidad (ATR × multiplicadores), dibujando niveles y zonas de riesgo/recompensa en el gráfico. 🎨 Las velas se colorean por fase para facilitar la lectura.
⚙️ Impacto de Parámetros
• Mayor sensibilidad vs. robustez:
- 📉 Períodos más cortos de ATR y suavizado reaccionan más rápido a las reversiones pero generan más ruido.
- 📊 Períodos más largos suavizan señales falsas pero pueden retrasar la detección.
- 🔍 Multiplicadores más grandes ensancha bandas y stops, reduciendo señales prematuras pero aumentando el retraso o pérdidas si la reversión esperada falla.
- 🎯 Objetivos más pequeños aseguran ganancias moderadas rápidamente; objetivos más grandes apuntan a movimientos extendidos pero con menor probabilidad de acierto.
• Ajuste holístico: Combina configuraciones de volatilidad, bandas, suavizado y gestión de niveles para tu activo y marco temporal.
✅Directrices Operativas
• Prueba retrospectiva y demo a fondo—prueba diferentes combinaciones bajo condiciones variadas (tendencia, rango, alta/baja volatilidad).
• Combina con otros análisis: Soporte/resistencia, patrones de velas, volumen o indicadores confirmatorios.
• Gestión de riesgos: Dimensiona posiciones según la distancia del stop para mantener un porcentaje de riesgo fijo.
• Disciplina y revisión periódica: Evita sobreoptimizar con datos pasados; ajusta cuando cambian las condiciones del mercado.
Resumen
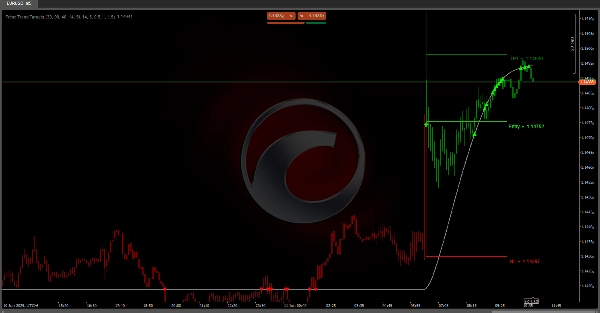
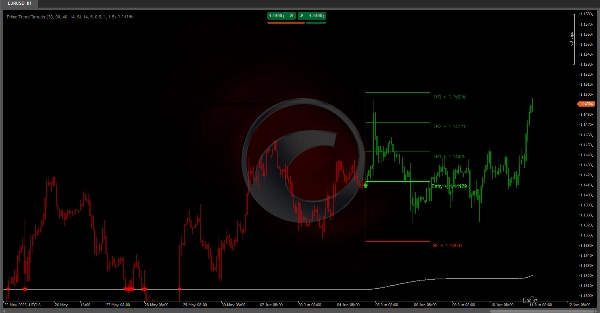
Upon confirming a phase shift, Prime Trend Targets projects key trading levels including entry points, stop loss, and up to three volatility-adjusted targets calculated as ATR multiplied by configurable multipliers. These levels are visually represented on the chart as risk/reward zones. Additionally, the indicator colors candles according to the current market phase for easier interpretation.
Users can adjust parameters to balance sensitivity and robustness: shorter ATR and smoothing periods increase responsiveness but may generate more noise, while longer periods reduce false signals but delay detection. Larger multipliers widen bands and stops, reducing premature signals but potentially increasing lag or losses if reversals fail. Target sizes can be set smaller for quicker gains or larger for extended moves with lower hit probability.
The indicator supports holistic tuning by combining volatility, band, smoothing, and level management settings tailored to specific assets and timeframes. Operational guidelines recommend thorough backtesting, combining with other analysis tools, applying risk management, and maintaining discipline with periodic reviews.
Valoraciones de clientes
5 | 0 % | |
4 | 100 % | |
3 | 0 % | |
2 | 0 % | |
1 | 0 % |