Descripción
VERSIÓN MEJORADA DISPONIBLE AQUÍ
¿Buscas más que solo superposiciones de marcos de tiempo nativos? El indicador mejorado Custom Timeframes amplía este concepto con potentes añadidos:
- Periodos no estándar (5H, 7H, 9H-23H, 25m, 35m, 50m, 55m, 4 días, 2 semanas, 3 semanas, multi-mensual, multi-anual)
- Líneas OHLC con control de desplazamiento de barra para barras completadas o en formación
- Siete niveles de Fibonacci (11.4% a 88.6%) con resaltado de zona de equilibrio
- Medias móviles calculadas directamente sobre la estructura de marco de tiempo personalizado (9 tipos de MA, 8 fuentes de precio)
- Botones de alternancia para gestión rápida de funciones.
Si necesitas periodos entre intervalos estándar del gráfico con superposición completa de análisis técnico, revisa la versión mejorada.
__________________________________________________________________________________________
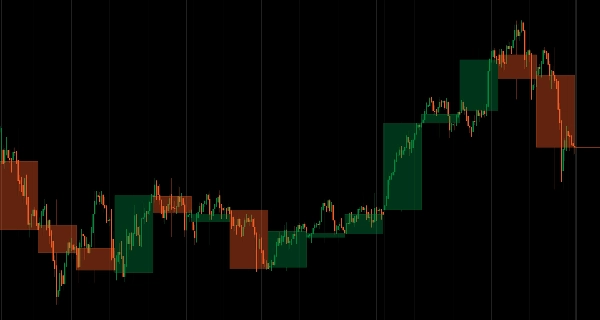
Superpone velas HTF en tiempo real en cualquier gráfico sin cambiar de marco temporal.
Muestra la estructura de velas de marcos de tiempo superiores (cuerpo y mechas) directamente en gráficos de marcos de tiempo inferiores con actualizaciones en vivo a medida que avanza el periodo.
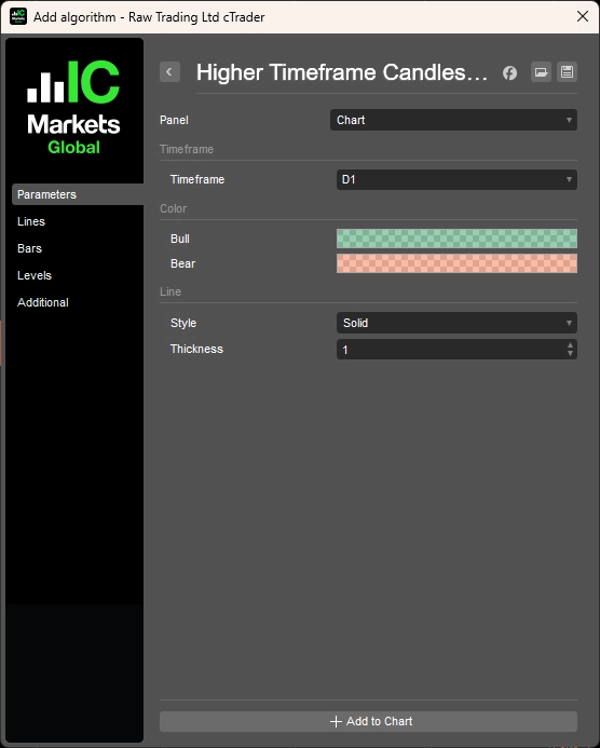
Selección flexible de marcos temporales (Diario en H1, Semanal en H4, Mensual en Diario), sesgo alcista/bajista codificado por colores (verde/rojo), estilo de línea y transparencia personalizables, y rendimiento ligero que ofrece contexto continuo HTF para traders que monitorean la estructura a través de múltiples marcos temporales sin cambiar de gráfico.
CARACTERÍSTICAS
Selección Flexible de Marco Temporal
- Cualquier HTF: Diario en H1, Semanal en H4, Mensual en Diario—a tu elección
- Actualizaciones en tiempo real: la vela HTF se redibuja a medida que avanza el periodo
- Siempre visible: opera en marcos de tiempo inferiores mientras mantienes el contexto de marcos superiores
Claridad Visual
- Codificado por colores: Alcista (verde), Bajista (rojo)—confirmación instantánea de sesgo
- Personalizable: estilo de línea, grosor, transparencia
- Presentación limpia: cuerpo y mechas claramente mostrados
Integración Simple
- No requiere cambiar de marco temporal
- Mantiene el contexto del gráfico mientras muestra la estructura HTF
- Ligero y optimizado para rendimiento
__________________________________________________________________________________________
MÁS INDICADORES GRATUITOS
Explora una amplia gama de herramientas de análisis de mercado—desde estructura y volumen hasta regresión, volatilidad y marcos temporales personalizados.
El código fuente está disponible en el repositorio de GitHub repository.
Todos son gratuitos para usar. Pero si quieres apoyar con un café, puedes hacerlo aquí.
Soporte/Resistencia
Volumen
- Perfilador de Actividad de Volumen
- Analizador de Eficiencia de Volumen
- Análisis de Perfil de Volumen
- Perfil de Volumen - Actualizado
- Análisis de Dispersión de Volumen
- VWAP (Precio Promedio Ponderado por Volumen)
Medias Móviles
- Media Móvil Anclada
- Media Móvil Escalada por Desviación
- Línea de Tendencia Instantánea
- MA Adaptativa de Kaufman con Visión de Tendencia
- Canal de Media Móvil
- Suite de Medias Móviles
- Media Móvil de Canal de Tendencia
Utilidades/Personalizado
Basado en Regresión
Volatilidad
Osciladores
__________________________________________________________________________________________
DESCARGO DE RESPONSABILIDAD
El trading implica riesgos. Este indicador está destinado únicamente para análisis técnico — siempre aplica una gestión adecuada del riesgo y opera con responsabilidad.
COMENTARIOS Y MEJORAS
Si tienes sugerencias, solicitudes de funciones o ideas para mejorar, por favor deja un comentario en la pestaña de Discusión. Tus comentarios ayudan a mejorar el indicador para todos.