
Deskripsi
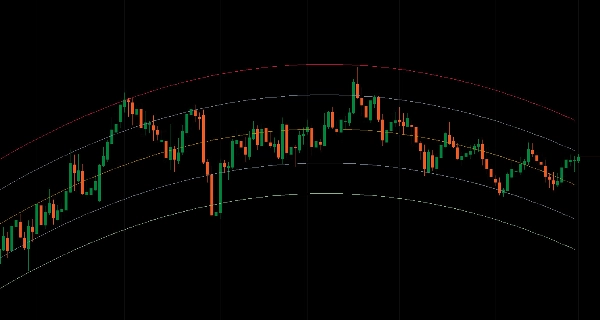
Saluran regresi statistik dengan level Fibonacci di berbagai jenis perhitungan, kerangka waktu, dan rentang tanggal.
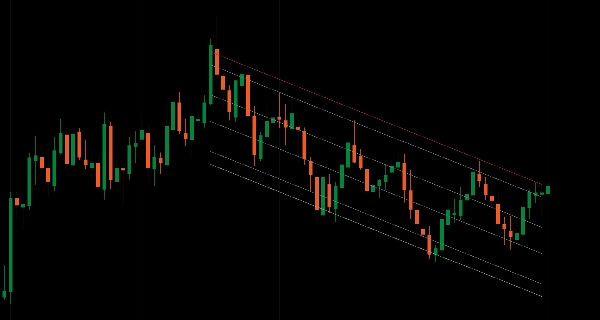
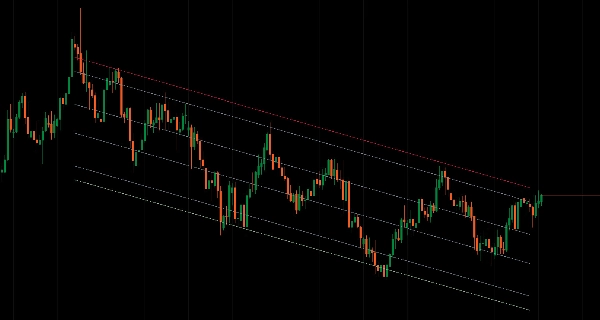
Memasang garis regresi melalui data harga menggunakan delapan metode (Linear, Logaritmik, Eksponensial, Terbobot, Polinomial, Bergerak, Eksponensial Bergerak, LOWESS) dengan pita deviasi standar untuk analisis mean reversion.
Sembilan level saluran Fibonacci (0% hingga 100%), analisis multi-kerangka waktu di 16 periode dengan rendering interpolasi, tiga mode perhitungan (Berbasis Periode, Rentang Tanggal, MTF), kontrol derajat polinomial (1-5) untuk struktur tren melengkung, pengali deviasi standar untuk penyesuaian lebar saluran, parsing datetime yang sadar zona waktu untuk analisis peristiwa, proyeksi garis tren yang diperpanjang hingga tak terhingga, dan caching LRU yang dioptimalkan memberikan analisis regresi statistik komprehensif bagi trader yang menargetkan zona mean reversion dan struktur harga melengkung di berbagai kondisi pasar.
FITUR
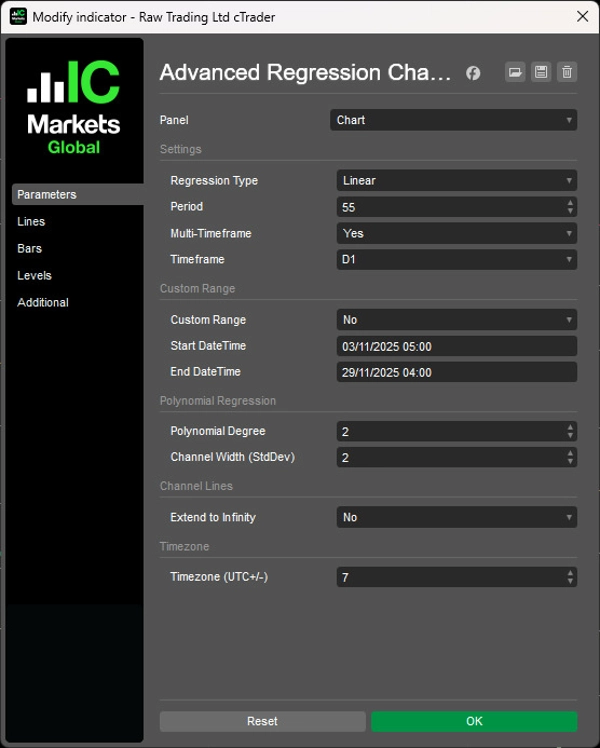
8 Jenis Perhitungan Regresi
- Linear: Regresi linear kuadrat terkecil klasik
- Logaritmik: Regresi berbasis log alami untuk pergerakan harga eksponensial
- Eksponensial: Pemasangan kurva eksponensial untuk tren yang mempercepat
- Terbobot: Regresi linear dengan bobot lebih besar pada bar terbaru
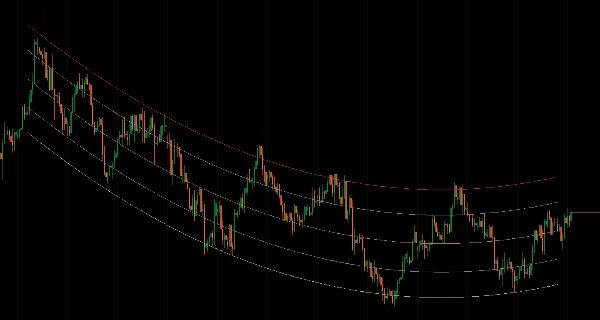
- Polinomial: Pemasangan melengkung (derajat 1-5) untuk tren non-linear
- Bergerak: Regresi berbasis rata-rata bergerak
- Eksponensial Bergerak: Regresi berbasis EMA untuk pelurusan tren
- LOWESS: Regresi berbobot lokal untuk pelurusan adaptif
9 Level Saluran Fibonacci
- Rentang saluran penuh: 100% (atas), 88,6%, 76,4%, 61,8%, 50% (garis tengah), 38,2%, 23,6%, 11,4%, 0% (bawah)
- Zona mean reversion di dalam pita regresi
- Titik referensi support/resistance yang tepat
- Kontrol warna/gaya/ketebalan independen untuk setiap level
Analisis Multi-Kerangka Waktu
- Hitung regresi pada kerangka waktu lebih tinggi, tampilkan di grafik saat ini
- 16 kerangka waktu tersedia (m1 hingga Bulanan)
- Nilai saluran terinterpolasi untuk rendering halus di seluruh bar grafik
- Struktur kerangka waktu lebih tinggi tanpa mengganti grafik
3 Mode Perhitungan
- Berbasis Periode: Jendela bergulir dari N bar (default)
- Rentang Tanggal: Waktu mulai/akhir khusus untuk peristiwa atau fase tertentu dengan parsing datetime yang sadar zona waktu (offset UTC+/-)
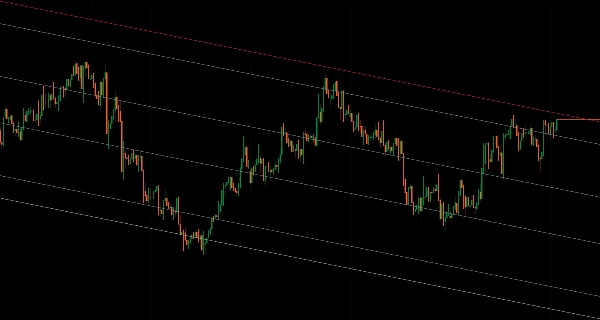
Opsi Tampilan Saluran
- Output Standar: Plot semua 9 level sebagai garis indikator
- Perpanjang ke Tak Terhingga: Render sebagai garis tren yang memproyeksikan ke depan tanpa batas
- Penyegaran otomatis saat warna/gaya berubah
- Rendering bersih—tidak ada nilai residual di luar jendela perhitungan
Mode Rentang Tanggal
- Tentukan tanggal mulai/akhir yang tepat (format dd/MM/yyyy HH:mm)
- Analisis peristiwa pasar, fase, atau struktur tertentu
- Independen dari parameter periode
- Konversi zona waktu dari waktu lokal pengguna ke waktu server
Perhitungan Dinamis
- Pembaruan waktu nyata saat bar baru terbentuk
- Caching LRU yang dioptimalkan dengan pelacakan rentang kotor
- Ukuran cache adaptif berdasarkan kerangka waktu
- Pencarian biner untuk pencarian rentang tanggal cepat
Kontrol Lebar Saluran
- Pengali deviasi standar (default 2.0)
- Pita lebih lebar untuk ekspansi volatilitas
- Pita lebih ketat untuk pasar yang terbatas rentangnya
- Konsisten di semua jenis regresi
Regresi Polinomial
- Kontrol derajat: 1-5 (lebih tinggi = lebih melengkung)
- Menangkap tren non-linear
- Berguna untuk struktur harga parabola atau melengkung
- Kembali ke linear saat derajat = 1
Manajemen Visual Bersih
- Tidak ada perhitungan pada bar yang sedang terbentuk—hanya bar yang selesai
- Pemotongan multi-kerangka waktu yang tepat—garis berakhir pada bar HTF terakhir yang selesai
- Ekstrapolasi berbasis kemiringan untuk proyeksi arah yang konsisten
- Seri output yang jelas dengan nama level deskriptif
__________________________________________________________________________________________
INDIKATOR GRATIS LAINNYA
Jelajahi berbagai alat analisis pasar—dari struktur dan volume hingga regresi, volatilitas, dan kerangka waktu khusus.
Kode sumber tersedia di repositori GitHub.
Semua gratis untuk digunakan. Namun jika Anda ingin memberikan dukungan kopi, Anda dapat mengarahkannya di sini.
Support/Resistance
Volume
- Volume Activity Profiler
- Volume Efficiency Analyzer
- Volume Profile Analytics
- Volume Profile - Updated
- Volume Spread Analysis
- VWAP (Volume Weighted Average Price)
Moving Averages
- SSL Channel
- Anchored Moving Average
- Deviation-Scaled Moving Average
- Gann High Low Activator
- Instantaneous Trendline
- Kaufman Adaptive MA with Trend Vision
- Moving Average Channel
- Moving Averages Suite
- Trend Channel Moving Average
Utilities/Custom
Berbasis Regresi
Volatilitas
Osilator
__________________________________________________________________________________________
PENAFIAN
Perdagangan melibatkan risiko. Indikator ini dimaksudkan hanya untuk analisis teknis — selalu terapkan manajemen risiko yang tepat dan berdagang dengan bertanggung jawab.
UMPAN BALIK & PENINGKATAN
Jika Anda memiliki saran, permintaan fitur, atau ide untuk peningkatan, silakan tinggalkan komentar di tab Diskusi. Umpan balik Anda membantu meningkatkan indikator untuk semua orang.
Ringkasan
It offers multi-timeframe analysis across 16 periods (from 1 minute to monthly), enabling regression calculations on higher timeframes displayed on the current chart with smooth interpolated rendering. Users can select among three calculation modes: Period-Based (rolling window), Date Range (custom start/end with timezone-aware parsing), and Multi-Timeframe. Channel width is adjustable via a standard deviation multiplier to reflect market volatility.
The indicator features real-time dynamic updates, optimized caching for performance, and extend-to-infinity trendline projections for forward-looking analysis. Visual output is clean, with slope-based extrapolation and no calculations on forming bars. This tool is designed for traders analyzing mean reversion and complex price structures across various market conditions.


