Deskripsi
Panel kontrol grafik untuk navigasi lebih cepat — zoom, kerangka waktu, dan pengaturan grafik tanpa meninggalkan grafik.
Preset zoom, entri zoom manual, pemilih kerangka waktu penuh dan grafik, kerangka waktu favorit yang dapat dikonfigurasi, pemisah periode, grid angka bulat, dan garis bid/ask langsung — semua dapat diakses melalui tombol UI di grafik. Dirancang untuk mengurangi waktu yang dihabiskan untuk menavigasi menu asli cTrader selama sesi perdagangan aktif.
FITUR
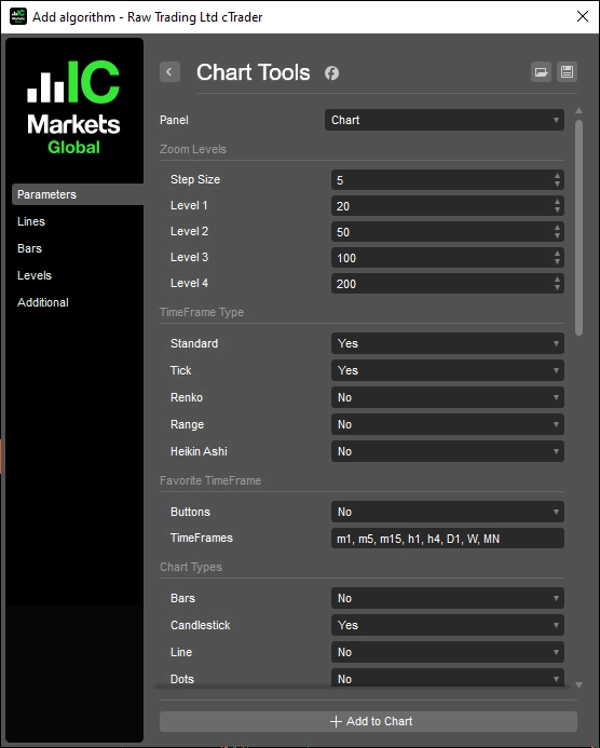
Kontrol Zoom
- Zoom in / zoom out dengan ukuran langkah yang dapat dikonfigurasi
- Empat level zoom preset yang dapat dikonfigurasi untuk akses satu klik
- Entri zoom manual dengan tombol terapkan
- Sinkron dengan event zoom asli cTrader
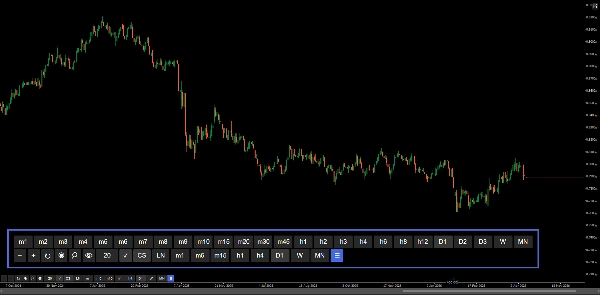
Pemilih Kerangka Waktu
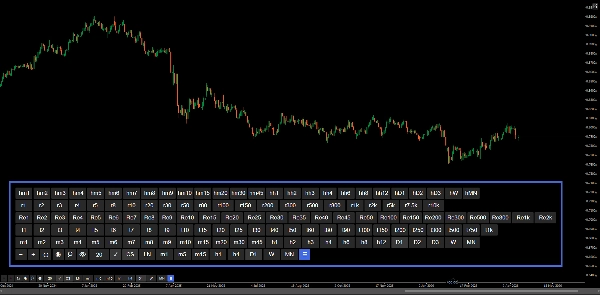
- Panel tombol lengkap yang mencakup semua jenis kerangka waktu: Standar, Heikin Ashi, Renko, Range, Tick
- Mode Semua menampilkan setiap jenis sebagai baris terpisah
- Kerangka waktu aktif disorot secara otomatis
- Alihkan visibilitas panel dengan tombol ☰
Kerangka Waktu Favorit
- Baris akses cepat yang dapat dikonfigurasi melalui input yang dipisahkan koma (misalnya m1, h1, D1)
- Mendukung semua jenis kerangka waktu termasuk Range dan Tick
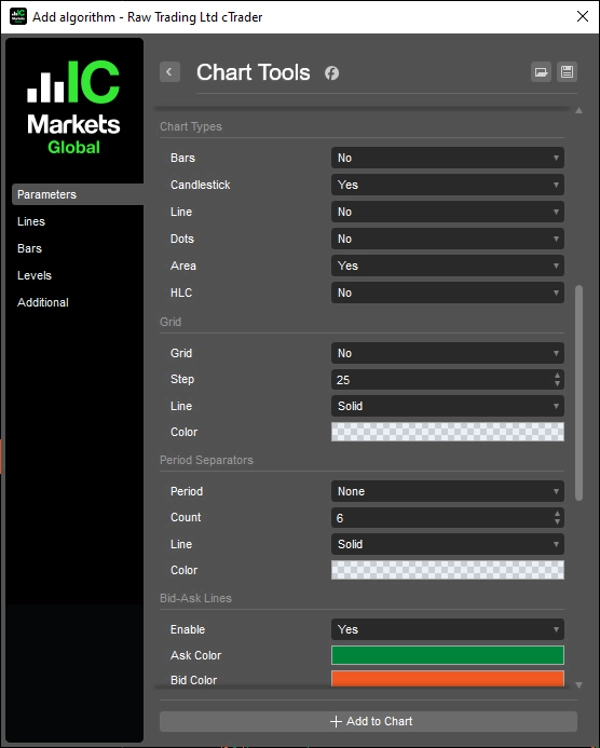
Jenis Grafik
- Tombol pengalih cepat untuk: Bars, Candlestick, Line, Dots, Area, HLC
- Jenis grafik aktif disorot secara otomatis
- Setiap tombol dapat dikonfigurasi secara individual melalui parameter
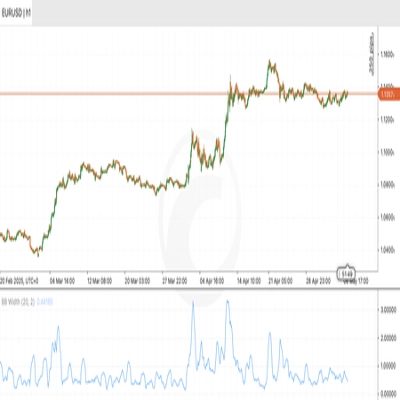
Grid
- Grid berbasis angka bulat dengan interval pip yang dapat dikonfigurasi (Pengali)
- Label harga dengan format desimal pintar
- Garis memanjang 10 bar melewati bar terakhir
- Tombol aktif/nonaktif
Pemisah Periode
- Pemisah Harian, Mingguan, Bulanan, dan Tahunan
- Jumlah, warna, gaya garis, dan ketebalan yang dapat dikonfigurasi
- Pembaruan otomatis saat menggulir dan zoom
Garis Bid/Ask
- Garis bid dan ask langsung yang memanjang tanpa batas
- Warna yang dapat dikonfigurasi untuk ask dan bid
- Tombol aktif/nonaktif
Tombol
- Posisi: Kanan Atas, Kiri Atas, Kanan Bawah, Kiri Bawah
- Margin yang dapat dikonfigurasi
- Warna tombol dan warna teks yang dapat dikonfigurasi — termasuk status aktif, terapkan zoom, dan tombol toggle grafik
__________________________________________________________________________________________
INDIKATOR GRATIS LAINNYA
Jelajahi berbagai alat analisis pasar—dari struktur dan volume hingga regresi, volatilitas, dan kerangka waktu khusus.
Kode sumber tersedia di repositori GitHub repository.
Semua gratis untuk digunakan. Tetapi jika Anda ingin mengirim dukungan kopi, Anda dapat mengarahkannya di sini.
Support/Resistance
Volume
- Volume Activity Profiler
- Volume Efficiency Analyzer
- Volume Profile Analytics
- Volume Profile - Updated
- Volume Spread Analysis
- VWAP (Volume Weighted Average Price)
Moving Averages
- SSL Channel
- Anchored Moving Average
- Deviation-Scaled Moving Average
- Gann High Low Activator
- Instantaneous Trendline
- Kaufman Adaptive MA dengan Trend Vision
- Moving Average Channel
- Moving Averages Suite
- Trend Channel Moving Average
Utilities/Custom
Berbasis Regresi
Volatilitas
Osilator
__________________________________________________________________________________________
PENAFIAN
Perdagangan melibatkan risiko. Indikator ini dimaksudkan hanya untuk analisis teknis — selalu terapkan manajemen risiko yang tepat dan berdagang dengan bertanggung jawab.
MASUKAN & PENINGKATAN
Jika Anda memiliki saran, permintaan fitur, atau ide untuk peningkatan, silakan tinggalkan komentar di tab Diskusi. Masukan Anda membantu meningkatkan indikator untuk semua orang.
Ringkasan
Users can configure a quick-access row of favorite timeframes supporting all timeframe types. The chart type switcher offers quick buttons for Bars, Candlestick, Line, Dots, Area, and HLC charts, each with individual configuration and automatic active state highlighting.
Additional features include a round numbers-based grid with configurable pip intervals and smart decimal formatting, daily to yearly period separators with customizable appearance, and live bid/ask lines extending indefinitely with color customization and toggle options.
The control panel’s buttons can be positioned in any corner of the chart with configurable margins and colors, including active states and zoom application. This tool aims to streamline active trading sessions by reducing time spent navigating native menus, supporting efficient technical analysis on various chart types and timeframes.
Ulasan pelanggan
5 | 100 % | |
4 | 0 % | |
3 | 0 % | |
2 | 0 % | |
1 | 0 % |