
คำอธิบาย
ตัวบ่งชี้นี้อิงจากการวิเคราะห์ price action 📈 เพื่อระบุการเปลี่ยนแปลงในโครงสร้างตลาดและพื้นที่สำคัญที่น่าสนใจ ด้านล่างนี้คือสรุปอย่างละเอียดเกี่ยวกับวิธีการทำงาน:
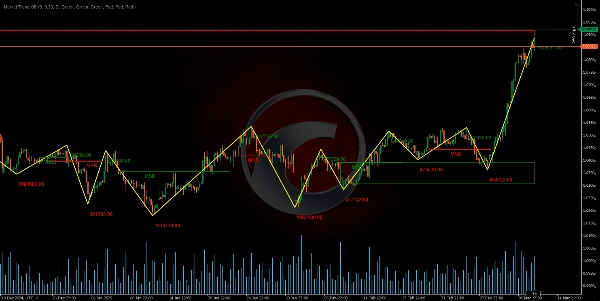
การตรวจจับจุดเปลี่ยนและการสร้างรูปแบบ Zigzag 🔄
ช่วงเวลาที่กำหนด (โดยพารามิเตอร์ความยาว) จะถูกวิเคราะห์เพื่อระบุจุดสูงและต่ำสัมพัทธ์ โดยการเปรียบเทียบราคาภายในช่วงเวลานั้น pivot points (จุดเปลี่ยนทิศทาง) จะถูกตรวจจับ ซึ่งจะสร้าง รูปแบบ zigzag ⚡ รูปแบบนี้ช่วยแยกแยะเมื่อเกิด price reversal ขึ้น
การสะสมปริมาณและการคำนวณความเบี่ยงเบน 📊
ในระหว่างกระบวนการตรวจจับ pivot tick volume จะถูกสะสมในช่วงที่ประเมิน นอกจากนี้ยังคำนวณความแตกต่างเป็นเปอร์เซ็นต์ระหว่างราคาพิวอทเพื่อกำหนดว่าการเคลื่อนไหวมีความสำคัญเพียงพอหรือไม่ ความเบี่ยงเบนนี้จะถูกเปรียบเทียบกับเกณฑ์ที่กำหนด ซึ่งช่วยยืนยันว่าการเปลี่ยนแปลงในโครงสร้างนั้น เป็นจริง ✅
การกำหนดการแตกโครงสร้างตลาด (MSB) 🚨
ตัวบ่งชี้จะประเมินสองพิวอทสุดท้าย (ไม่ว่าจะเป็นจุดสูงหรือต่ำ) และโดยการใช้ retracement factor (ได้รับแรงบันดาลใจจากระดับ Fibonacci) เพื่อกำหนดว่ามี การแตกโครงสร้าง เกิดขึ้นหรือไม่
- ถ้าหลังจากทำลายจุดสูงเก่า ราคาเริ่มสร้าง lower lows จะมีการเปลี่ยนไปสู่ โครงสร้างขาลง 🐻
- ในทำนองเดียวกัน ถ้าหลังจากทำลายจุดต่ำเก่า ราคาเกิด higher highs จะถือว่าเป็นการเปลี่ยนไปสู่ โครงสร้างขาขึ้น 🐂
การเปลี่ยนแปลงนี้ถูกตีความว่าเป็น Market Structure Break (MSB).
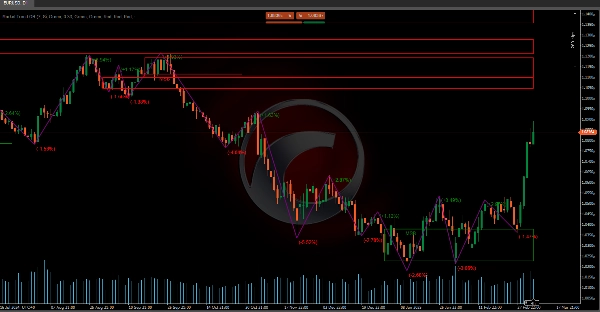
การระบุ Order Blocks และ Breakout Boxes 📦
เมื่อพบ MSB จะมีการกำหนดโซนสำคัญตาม price action ก่อนหน้า:
- Order Blocks (OB) 🧱: โซนเหล่านี้ถูกระบุว่าเป็นพื้นที่ที่เกิดการเคลื่อนไหวสำคัญสุดท้ายก่อนการเบรค ในโครงสร้างขาลง เทียนขาขึ้นแท่งสุดท้ายก่อนจุดสูงใหม่จะถูกนำมาใช้; ในโครงสร้างขาขึ้น เทียนขาลงแท่งสุดท้ายก่อนจุดต่ำใหม่จะถูกใช้
- Breakout Boxes (BB) 📈: กำหนดในลักษณะเดียวกันแต่พิจารณาช่วงเพิ่มเติมเพื่อยืนยันว่าราคาทะลุระดับก่อนหน้า
โซนเหล่านี้ช่วยกำหนดพื้นที่ที่มีกิจกรรมเข้มข้นและอาจทำหน้าที่เป็น แนวรับหรือแนวต้าน ในอนาคต
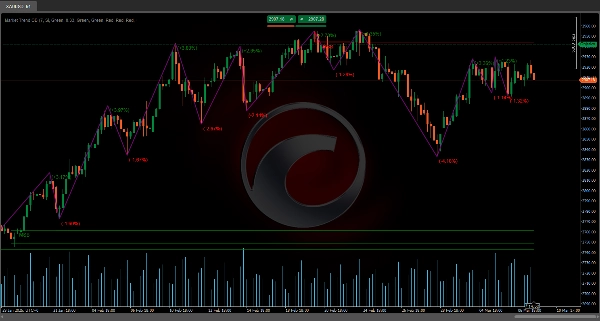
การแสดงข้อมูล Zigzag ที่เกี่ยวข้อง 📊
นอกจากการวาดลำดับของพิวอทแล้ว ตัวบ่งชี้ยังรวมข้อมูลเพิ่มเติม:
- Reversal Price 💹: บันทึกค่าที่แน่นอนที่ตรวจพบการเปลี่ยนแปลงแนวโน้ม
- Reversal Percentage Change 🔄: คำนวณเปอร์เซ็นต์ความแตกต่างระหว่างราคาพิวอทใหม่กับพิวอทก่อนหน้า เพื่อแสดงขนาดของการเปลี่ยนแปลง
- Accumulated Volume 📉: แสดงผลรวมของ tick volume ในช่วงที่นำไปสู่การสร้างพิวอท
ข้อมูลนี้ช่วยให้ประเมิน ความแข็งแกร่งและความเกี่ยวข้อง ของการเคลื่อนไหวโดยไม่ต้องพึ่งพาสมมติฐาน เพราะอิงจากการคำนวณที่ชัดเจน
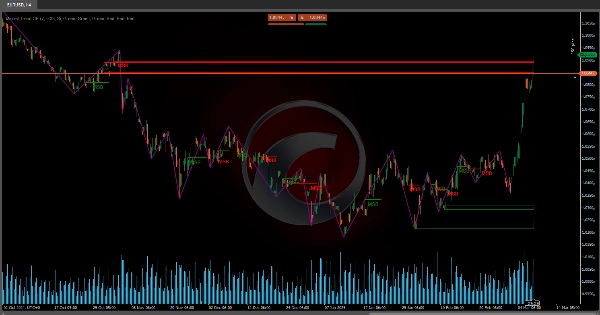
โดยสรุป เครื่องมือนี้วิเคราะห์ price action เพื่อตรวจจับเมื่อตลาดเปลี่ยนแนวโน้ม (MSB) และกำหนดโซน (order blocks และ breakout boxes) ที่อาจเป็นกุญแจสำคัญสำหรับ การตัดสินใจซื้อขาย 💼 การผสมผสานรูปแบบ zigzag กับ การวิเคราะห์ปริมาณ และ ความเบี่ยงเบนเป็นเปอร์เซ็นต์ ให้ภาพรวมที่ครอบคลุมของโครงสร้างตลาด โดยให้ข้อมูลที่แม่นยำเกี่ยวกับ จุดกลับตัว และ ความแข็งแกร่งของการเคลื่อนไหว 💪
ตัวบ่งชี้ Ctrader Store:
Dynamic Market Structure
Analysis of Turning Points
Fibonacci Linear
Regression Multi-timeframe
Multi-Level Candle Bias
Tracker
Auto Support and
Resistance Trend Lines
สรุป
It defines Market Structure Breaks (MSB) by evaluating recent pivots with a retracement factor inspired by Fibonacci levels. A break in structure is signaled when price action shifts from higher highs to lower lows (bearish) or from lower lows to higher highs (bullish).
Upon detecting an MSB, the indicator identifies critical zones: Order Blocks (OB), representing the last significant candle before a breakout, and Breakout Boxes (BB), which confirm price level breaches with an additional range. These zones serve as potential future support or resistance areas.
The tool visualizes relevant zigzag data, including reversal prices, percentage changes, and accumulated volume, enabling assessment of movement strength and relevance based on concrete calculations. This comprehensive approach integrates zigzag patterns, volume analysis, and deviation metrics to provide precise information on reversal points and market movement strength, supporting informed trading decisions.
รีวิวจากลูกค้า
5 | 100 % | |
4 | 0 % | |
3 | 0 % | |
2 | 0 % | |
1 | 0 % |


!["[Hamster-Coder] Pivot Points (Demo)" โลโก้](https://cdn.ctrader.com/image/webp/87b54299-8c73-4942-9207-4bc6db824811_31153)


!["[Stellar Strategies] Market Session Ultimate" โลโก้](https://cdn.ctrader.com/image/webp/61ffd537-0125-4246-9e72-42eca1791d64_28232)

!["[Stellar Strategies] Ultimate Trend & Momentum Dashboard" โลโก้](https://cdn.ctrader.com/image/webp/e9a9c9e9-4b6c-4bc0-9988-4c4768a23b6c_30290)