説明
Pinescriptlabs ストアインジケーター: 🤖Pinescriptlabs ストア cBots :
ICT Power of 3 (cBot) Gold & BTC BreakoutSession Pivots(新)YieldShield"
プレミアムSSLチャネル 🔍
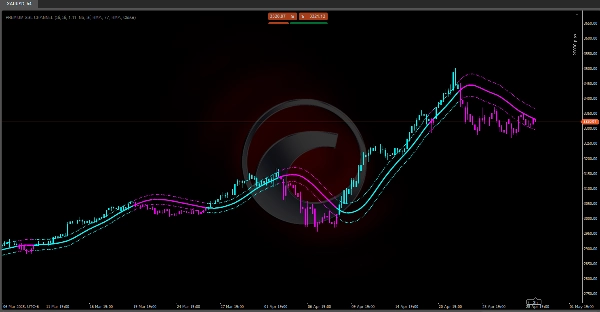
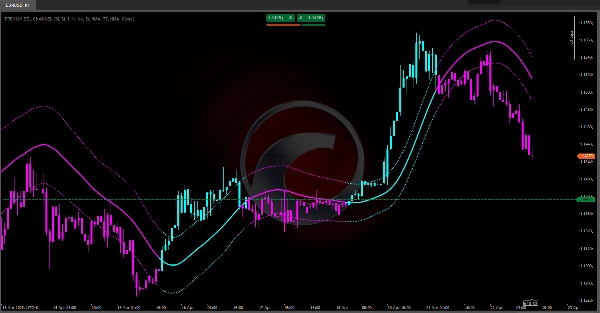
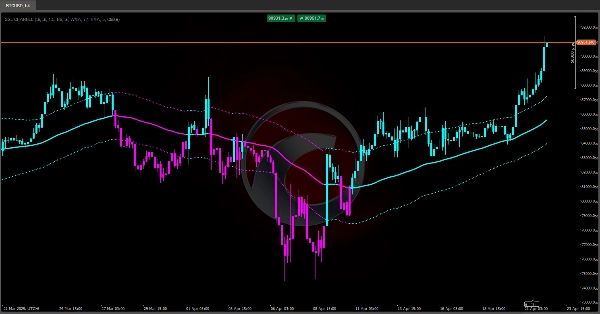
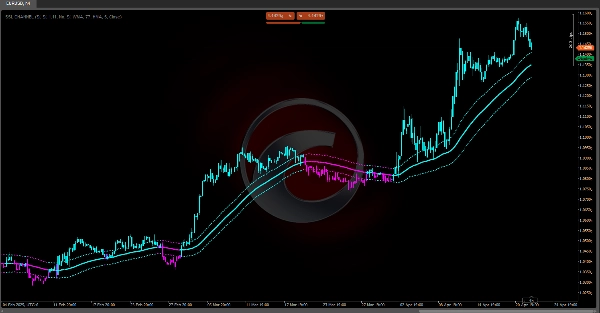
移動平均によるトレンド検出、ATRベースのバンドによるボラティリティ評価、および短期フィルター(SSL)を組み合わせた統合分析システムを提供します。💡 その強みは視覚的信号の明確さと市場間での適応性にあり、主な課題は遅延の最小化と横ばい動作のフィルタリングです。適切なパラメータ設定により、取引のエントリー/エグジット判断に強力なツールとなります。🎯
1. 目的と取引の有用性 📊
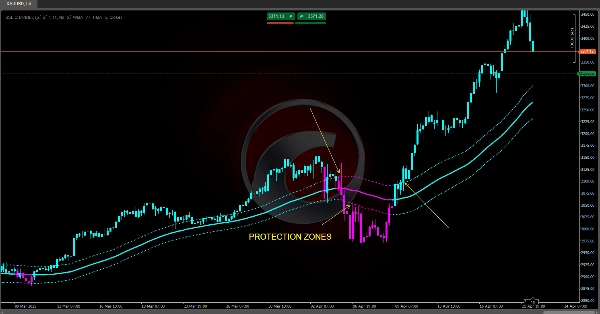
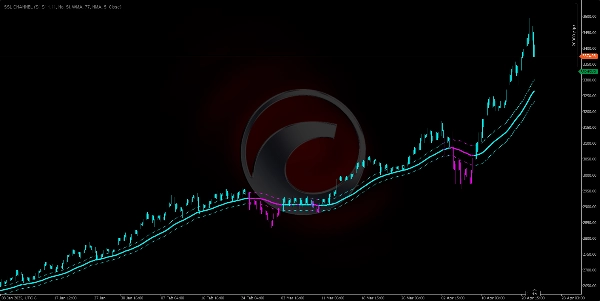
• 主要トレンド検出:中央線(「ベースライン」)により、市場の支配的な方向を示します。📈📉
• ボラティリティ測定:平均レンジ(ATR)を使用し、ベースラインの上下に2つのバンドを動的なサポート/レジスタンスゾーンとして調整します。⚡
• ノイズフィルターとバイアスシフト:SSLチャネル(高値/安値に基づく適応移動平均)が短期の反転を特定し、正確なエントリー/エグジットを可能にします。🔄
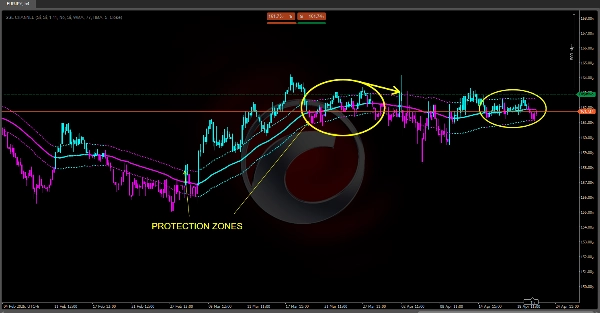
• 直感的な視覚化:バイアスに応じて価格バーとラインを色分け(シアン=強気、マゼンタ=弱気)し、即座に解釈可能にします。🎨
2. コアコンポーネントとロジック ⚙️
2.1. 中央線(「ベースライン」)
• ノイズを平滑化するために価格の移動平均(SMA、EMA、WMA、またはHull)を計算します。
• 市場の平均値を表し、支配的なトレンドを示します:
- 価格が上回る → 強気トレンド。🟢
- 価格が下回る → 弱気トレンド。🔴
2.2. 平均レンジ(ATR)
• 過去の高値/安値/終値の平均を取り、市場の実際のボラティリティを測定します。
• ATRが高い = ボラティリティが高い; ATRが低い = 市場が穏やか。🌊
2.3. 動的バンド(「アップATR」&「ダウンATR」)
• アップATR = ベースライン + (ATR × 乗数)
• ダウンATR = ベースライン – (ATR × 乗数)
• 価格チャネルとして機能します:
- 価格が上部バンドに触れる → 強気の強さ。🚀
- 価格が下部バンドに近い → 弱気の勢い。🐻
2.4. SSLチャネル(Signal-Smooth-Line)
• 高値と安値に別々に移動平均を使用します。
• 方向のロジック:
- 終値が高いMAの上→ 強気バイアス。✅
- 終値が低いMAの下→ 弱気バイアス。❌
- 間にある場合 → 以前のバイアスが維持されます。
• ベースラインを確認/否定する短期トレンドフィルターとして機能します。🔄
3. シグナル生成と実用的な使用法 🛠️
1. トレンド確認
- 強い強気:価格 > アップATR。🟢
- 中程度の強気:アップATR > 価格 > ベースライン。
- 中程度の弱気:ベースライン > 価格 > ダウンATR。
- 強い弱気:価格 < ダウンATR。🔴
2. SSLフィルター
- エントリー:SSLがそのラインの上にある場合のみロング(下にある場合はショート)。⬆⬇
- エグジット:SSLが反転し、反対の高値/安値MAをクロスしたときに部分的/全体的に退出。✋
3. バーカラーリング
- 価格バーがシアン(強気)またはマゼンタ(弱気)に変わり、ベースラインと同期して市場の読み取りを迅速化します。🎨
4. 設定可能なパラメーターと影響 ⚖️
• ベースライン期間:長いほど滑らかだが遅延が大きく、短いほど応答性が高いがノイズが多い。🐢⚡
• バンド乗数:高いほどチャネルが広く(誤信号が少ない)、低いほど狭く(信号が多く、だましが多い)。↔️
• MAタイプ(SMA/EMA/WMA/HMA):最近の価格と過去の価格の重み付けに影響します。📅
• SSL期間とタイプ:短期フィルターの感度を定義します。🎚️
5 | 100 % | |
4 | 0 % | |
3 | 0 % | |
2 | 0 % | |
1 | 0 % |