
説明
🔥 Pinescritlabs
Ctrader Store indicators: 🤖Pinescritlabs Ctrader Store cBots:
Fair Value Gap Sessions Gold & BTC Breakout Session Pivots
Dynamic Market Structure
Analysis of Turning Points
Fibonacci Linear
Regression Multi-timeframe
Multi-Level Candle Bias
Tracker
Auto Support and
Resistance Trend Lines
All Support and
Resistance Levels
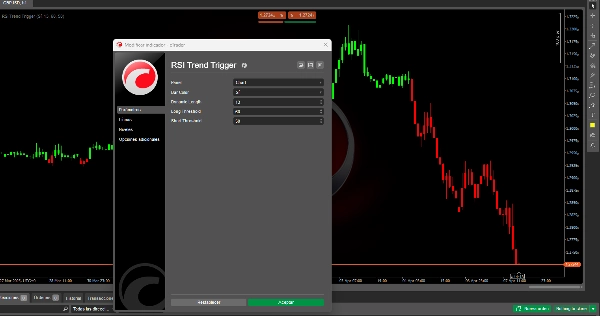
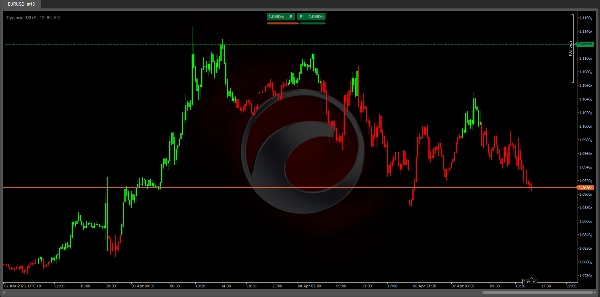
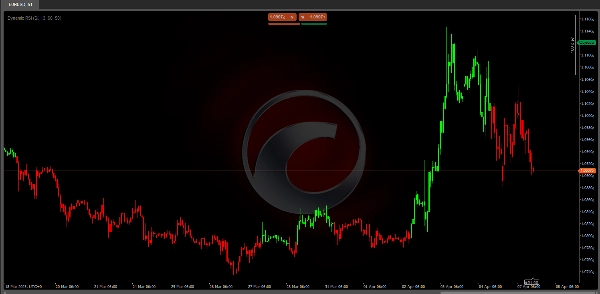
RSI Trend Trigger 📈✨
How Does It Work? 🤔
Step 1: Traditional RSI
標準の 相対力指数(RSI) が計算され、一定期間の価格変動の速度と大きさを測定します。0から100の間で振動し、買われ過ぎの状態(例:70以上)や売られ過ぎの状態(例:30以下)を識別します。📊📉📈
Step 2: Dynamic Refinement
従来のRSIは 高度な平滑化プロセスを経ます:
- 元のRSI値(価格自体ではなく)に対して 二次の数学的計算が適用されます。
- このステップにより、RSIのより安定したバージョンが作成され、小さな変動(市場ノイズ)が減少し、本物のトレンドが強調されます。
- 基本的な平滑化とは異なり、この方法は 重要なモメンタムの変化に対する応答性を維持し、過度な遅延を避けます。🛡️🔄
なぜこの改良が重要なのか? 🤩
- スマートフィルタリング:ニュースの急騰や投機的な動きなど、一時的なボラティリティによる誤ったシグナルを排除します。🗑️
- より鮮明なトレンド:二重計算アプローチにより、小さな調整と本当のトレンド反転を区別します。🎯
- 持続的なシグナル:トレンド(強気/弱気)が確認されると、明確な反転が起こるまでインジケーターはその状態を保持し、不安定なシグナルの飛び跳ねを避けます。🔒
実用例:閾値と意思決定 📈
改良されたRSIは 2つの調整可能な閾値と組み合わされます:
- 強気の閾値(例:60):
-
- 改良されたRSIがこのレベルを上回ると、 強気トレンドが確認されます。🚀
- ローソク足が緑色に変わります
- 弱気の閾値(例:50):
-
- 改良されたRSIがこのレベルを下回ると、 弱気トレンドが発動します。📉
- ローソク足が赤色に変わります
重要なルール:
- シグナルは トレンド変化時のみ表示され(すべての変動時ではなく)、情報過多を減らします。🚫📢
- 閾値はカスタマイズ可能:ボラティリティの高い市場には高めの値(例:65/55)、滑らかなトレンドには低めの値(例:55/45)を使用します。⚙️
トレーダーへの利点 🏆
- 精度の向上:
-
- 二重フィルタリングにより誤シグナルが減少。横ばい市場やフェイクアウトに最適。✅
- 直感的な視覚化:
-
- 色付きローソク足と視覚的閾値でトレンドを即座に把握可能。👀🎨
- 適応性:
-
- 資産(FX、株式、暗号通貨)や時間軸(分から週単位)を問わず機能。🌍⏳
- トレンド重視の取引:
-
- モメンタムに沿った取引を支援し、リスクの高い逆トレンドの動きを回避。🎯🚦
シグナルの例の流れ
改良されたRSIが 55 (中立ゾーン)にあると想像してください:
- 強気シナリオ:62まで上昇し→60の閾値を超え→ローソク足が緑色に変わる🚀
- 弱気シナリオ:48まで下落し→50の閾値を下回り→ローソク足が赤色に変わる📉
概要
The indicator then applies an advanced smoothing process to the RSI values, not the price data, creating a refined RSI that reduces minor market noise while maintaining sensitivity to significant momentum changes. This dual-layer calculation enhances signal precision by filtering out false signals caused by temporary volatility and distinguishing between minor corrections and genuine trend reversals.
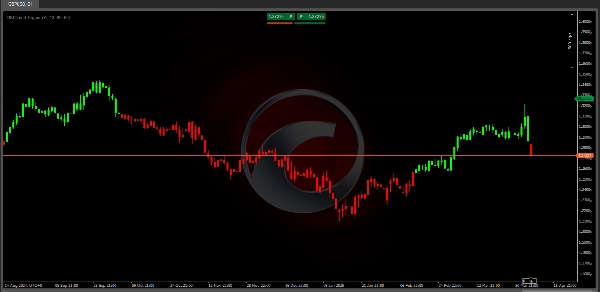
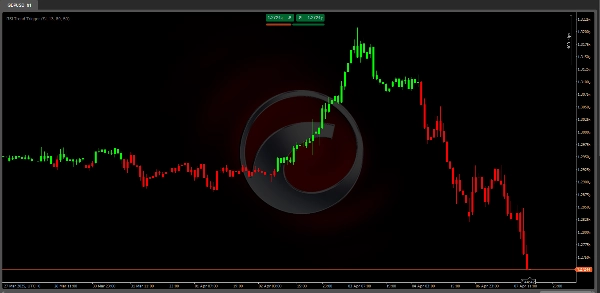
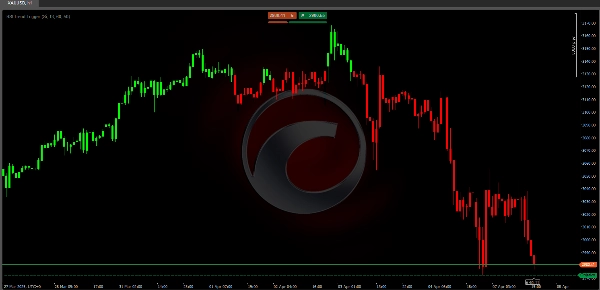
Users can customize two threshold levels—a bullish threshold (e.g., 60) and a bearish threshold (e.g., 50)—to define when a trend is confirmed. When the refined RSI crosses above the bullish threshold, the indicator signals a bullish trend with green candles; when it falls below the bearish threshold, it signals a bearish trend with red candles. Signals appear only during trend changes, reducing information overload.
The RSI Trend Trigger supports multiple timeframes from minutes to weeks and is adaptable to different market conditions, aiding traders in aligning with momentum and avoiding counter-trend risks.
カスタマーレビュー
5 | 67 % | |
4 | 33 % | |
3 | 0 % | |
2 | 0 % | |
1 | 0 % |


