
Volume Analysis Indicators for cTrader
Review volume analysis indicators for cTrader that support market participation and confirmation checks. These tools help forex and CFD traders assess activity, pressure, breakouts and possible exhaustion zones before entering a trade.
Tools
Tool comparison
FAQ
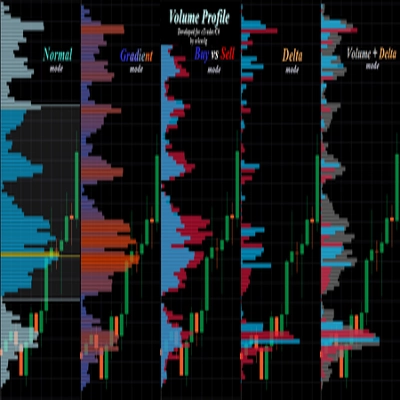
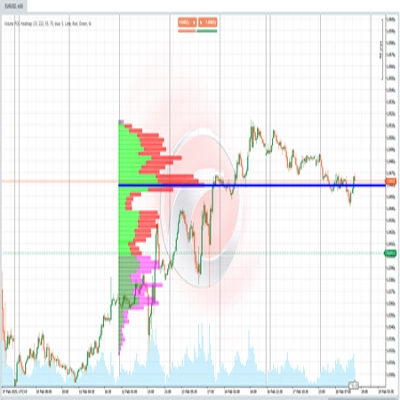












Tool comparison
Product | Reviews | Downloads | Sales | Price | Compatible platforms |
|---|---|---|---|---|---|
Free Volume Profile v2.0 | 4.8 (11) | 11.18K | — | Free | Windows, Mac |
Level 2 DOM Volume Delta Pro | 4.5 (2) | — | 9 | from $9 | Windows, Mac |
Volume POC Heatmap | 5.0 (4) | 4.14K | — | Free | Windows, Mac |
Volume Profile Pro v1.0 | 4.3 (3) | — | 5 | from $9 | Windows, Mac |
Zones Supply Demand | 3.5 (2) | 2.31K | — | Free | Windows, Mac |
Aggression Delta Volume Profile | — | — | 4 | $19 | Windows, Mac |
VolumeRenkoRange | 5.0 (1) | 1.54K | — | Free | Windows, Mac |
Volume Profile - Range and Fixed | — | — | 3 | $19 | Windows, Mac |
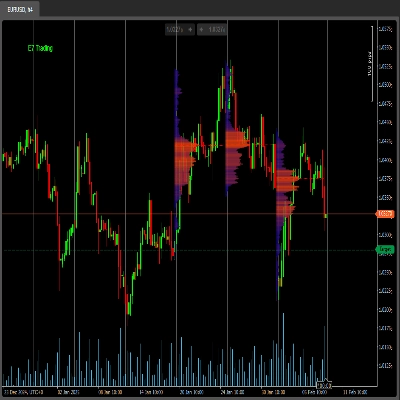
E7 Volume Profile | 4.7 (3) | 1.3K | — | Free | Windows, Mac |
Delta_Volume_Dynamic&Fixed Range | 4.3 (7) | — | 3 | $20 | Windows, Mac |
v-anesore2 | — | 1.09K | — | Free | Windows, Mac |
Session Volume Profile | — | — | 1 | $69 | Windows, Mac |
Volume Bubble | 4.0 (1) | 1.04K | — | Free | Windows, Mac |
Market profile Pro V2.1 | 4.0 (1) | — | — | $75 | Windows, Mac |
Volume Profile - Updated | 5.0 (2) | 1.03K | — | Free | Windows, Mac |
Easy Volume Profile | — | — | — | $120 | Windows, Mac |
Volume Profile Price | 3.5 (2) | 959 | — | Free | Windows, Mac |
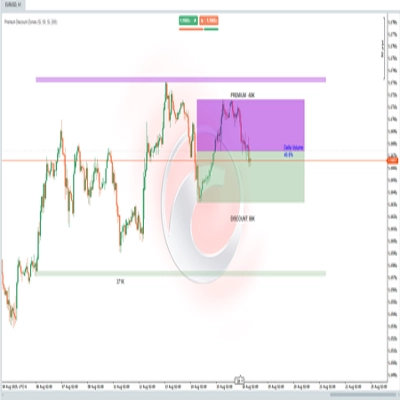
Premium Discount Zones | — | 807 | — | Free | Windows, Mac |
Swing profile Algotrend | — | 647 | — | Free | Windows, Mac |
Candle Volume Profile Demo | 4.0 (1) | 629 | — | Free | Windows, Mac |
PVA Volume+Analysis_noSourceCode | 5.0 (3) | 526 | — | Free | Windows, Mac |
VPOC MonteCarlo Expected Value | 1.0 (1) | 513 | — | Free | Windows, Mac |
VolumeThermometer | — | 492 | — | Free | Windows, Mac |
ZigZag Price Liquidity Projection | — | 424 | — | Free | Windows, Mac |
Master Dragom SR | 5.0 (1) | 424 | — | Free | Windows, Mac |
Price Projection Swing Volume | — | 411 | — | Free | Windows, Mac |
Vishal Volume Profile v2.0 | 4.0 (1) | 366 | — | Free | Windows, Mac |
Volume Spread Analysis | 5.0 (1) | 365 | — | Free | Windows, Mac |
Precio Promedio Ponderado por Volumen | — | 363 | — | Free | Windows, Mac |
Volume Squeeze Time | 4.5 (2) | 349 | — | Free | Windows, Mac |
Volume Break Structure | 4.0 (1) | 348 | — | Free | Windows, Mac |
Order Flow | — | 331 | — | Free | Windows, Mac |
[Stellar Strategies] Visual Trend Momentum | 5.0 (1) | 302 | — | Free | Windows, Mac |
Volume-Powered Market Flow Projector | 5.0 (1) | 289 | — | Free | Windows, Mac |
On Balance Volume | 5.0 (1) | 268 | — | Free | Windows, Mac |
Volume Activity Profiler | 5.0 (1) | 254 | — | Free | Windows, Mac |
WaveWeisBarForce | 5.0 (2) | 217 | — | Free | Windows, Mac |
Momentum Trend Analyzer | — | 212 | — | Free | Windows, Mac |
XY Bar Info Panel v1.5 | 5.0 (3) | 182 | — | Free | Windows, Mac |
IVT Global Scanner | 5.0 (1) | 173 | — | Free | Windows, Mac |
[Stellar Strategies] Market Regime Filter | — | 162 | — | Free | Windows, Mac |
Volume Efficiency Analyzer | 5.0 (1) | 150 | — | Free | Windows, Mac |
Weis Waves | 5.0 (1) | 124 | — | Free | Windows, Mac |
Ariaware.003PGap | 5.0 (1) | 90 | — | Free | Windows, Mac |
TiltBouncer | 5.0 (2) | 32 | — | Free | Windows, Mac |
FAQ
Tick volume counts how many times price changed during a bar, a stand-in used because spot forex has no central exchange. More ticks usually mean a busier market, so cTrader volume indicators treat it as a proxy for participation rather than a record of the amount traded.
On Balance Volume adds a bar's volume when the close rises and subtracts it when the close falls, building a running line. Traders compare its direction with price: a new price high without a new OBV high is read as weakening participation, though such divergence can persist for a long time.
It can support the case, as a breakout on clearly higher volume than recent bars suggests broad participation. Spikes also come from news releases, and gold or bitcoin volume depends on the broker's feed, so one spike settles nothing and breakouts still fail.
For many, yes: a tick volume histogram shows when activity rises and keeps the logic visible. Experienced chartists may add OBV, volume oscillators or estimated buy-sell delta, but those derived readings rest on assumptions about tick direction that deserve understanding before relying on them.
Custom volume indicators from the Store are limited to cTrader Windows and Mac, while the built-in tick volume and OBV studies work in every cTrader app. On desktop, pick the indicator from the chart's indicator list, then set its period, colours and panel layout separately on each chart.