Gann High Low Activator
อินดิเคเตอร์
82 ดาวน์โหลด
เวอร์ชัน 1.1, Apr 2026
Windows, Mac
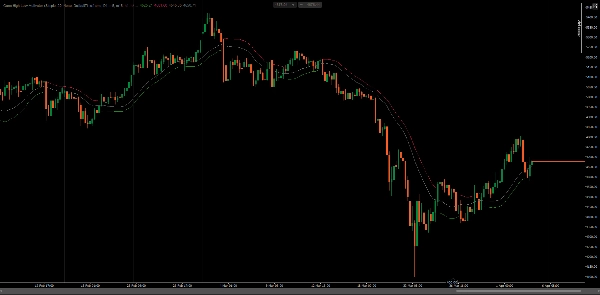
Trading product for Gann High Low Activator อินดิเคเตอร์ BTCUSD EURUSD, image 2
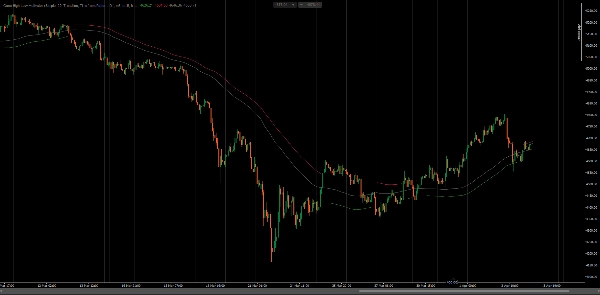
Trading product for Gann High Low Activator อินดิเคเตอร์ BTCUSD EURUSD, image 3
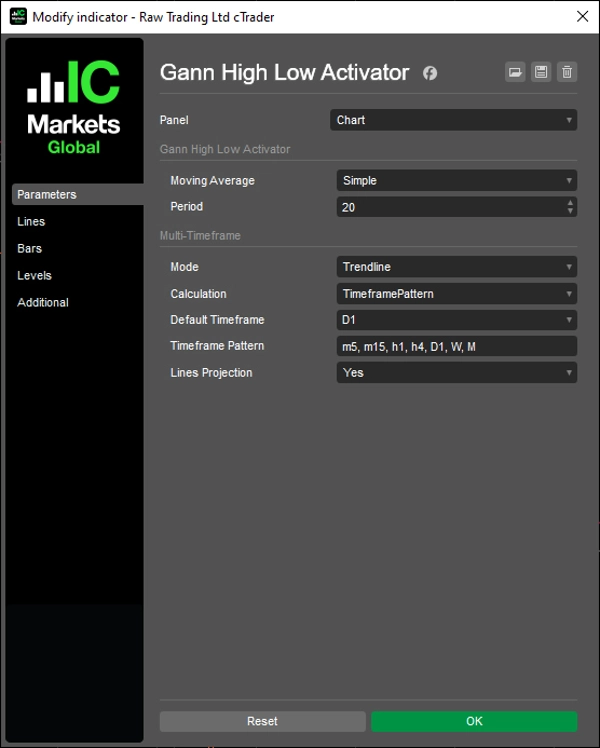
Trading product for Gann High Low Activator อินดิเคเตอร์ BTCUSD EURUSD, image 4
Trading product for Gann High Low Activator อินดิเคเตอร์ BTCUSD EURUSD, image 5
ตั้งแต่ 20/12/2024
7.92K
ติดตั้งฟรี

คำอธิบาย

การเปิดใช้งานแนวโน้มแบบ MA พร้อมโหมดหลายกรอบเวลาและการฉายเส้นแนวโน้ม


ติดตามทิศทางตลาดโดยการเปรียบเทียบราคาปิดกับค่าเฉลี่ยเคลื่อนที่ของราคาสูงและต่ำในช่วงเวลาที่กำหนดได้ สลับสถานะเมื่อราคาปิดตัดขึ้นเหนือ MA(High) เป็นขาขึ้น หรือ ต่ำกว่า MA(Low) เป็นขาลง — วาดแถบตรงข้ามเป็นระดับแนวรับหรือแนวต้านที่ใช้งานอยู่

โหมดการคำนวณสี่แบบ (ไม่มี, การประมาณค่า, ScaledPeriod, เส้นแนวโน้ม), ผลลัพธ์ MA เปิดและปิด, การแก้ไขรูปแบบกรอบเวลาเพื่อเลือก HTF อัตโนมัติ และการฉายเส้นแนวโน้มสำหรับการประมาณแถบถัดไป มอบกรอบการติดตามแนวโน้มที่ครบถ้วนสำหรับเทรดเดอร์ที่ทำงานข้ามหลายกรอบเวลาและสไตล์การวิเคราะห์


คุณสมบัติ


ตรรกะการเปิดใช้งานหลัก

  • สถานะขาขึ้น: เปิดใช้งานเมื่อราคาปิดตัดขึ้นเหนือ MA(High) — วาด MA(Low) เป็นแนวรับแบบไดนามิก
  • สถานะขาลง: เปิดใช้งานเมื่อราคาปิดตัดลงต่ำกว่า MA(Low) — วาด MA(High) เป็นแนวต้านแบบไดนามิก
  • ผลลัพธ์ MA เปิดและ MA ปิดสำหรับการวิเคราะห์ความสอดคล้องและการซ้อนทับเพิ่มเติม
  • รองรับค่าเฉลี่ยเคลื่อนที่ทุกประเภทของ cTrader (SMA, EMA, DEMA, TEMA, WMA เป็นต้น)

โหมดหลายกรอบเวลา

  • ไม่มี: การคำนวณกรอบเวลาเดียวมาตรฐานบนชาร์ตปัจจุบัน
  • การประมาณค่า: ค่าของ HTF ที่เรียบเนียนแมปเชิงเส้นไปยังแท่ง LTF สำหรับการซ้อนทับอย่างต่อเนื่อง
  • ScaledPeriod: ปรับขนาดช่วงเวลาตามอัตราส่วน HTF ต่อ LTF — ไม่ต้องใช้ชุดข้อมูลเพิ่มเติม
  • เส้นแนวโน้ม: วาดวัตถุเส้นแนวโน้มบนชาร์ตระหว่างขอบแท่ง HTF พร้อมการควบคุมสไตล์เต็มรูปแบบ

การแก้ไขกรอบเวลา

  • DefaultTimeframe: เลือก HTF ใดก็ได้ด้วยตนเองจากเมนูพารามิเตอร์
  • TimeframePattern: เลือกกรอบเวลาที่สูงกว่าใกล้เคียงที่สุดโดยอัตโนมัติจากรายการโทเค็นที่คั่นด้วยเครื่องหมายจุลภาค (เช่น m5, m15, h1, h4, D1, W, M)
  • โทเค็นรูปแบบรองรับนาที (m1–m45), ชั่วโมง (h1–h12), วัน (d1–d3), รายสัปดาห์ (W) และรายเดือน (M)

ฟีเจอร์เสริมโหมดเส้นแนวโน้ม

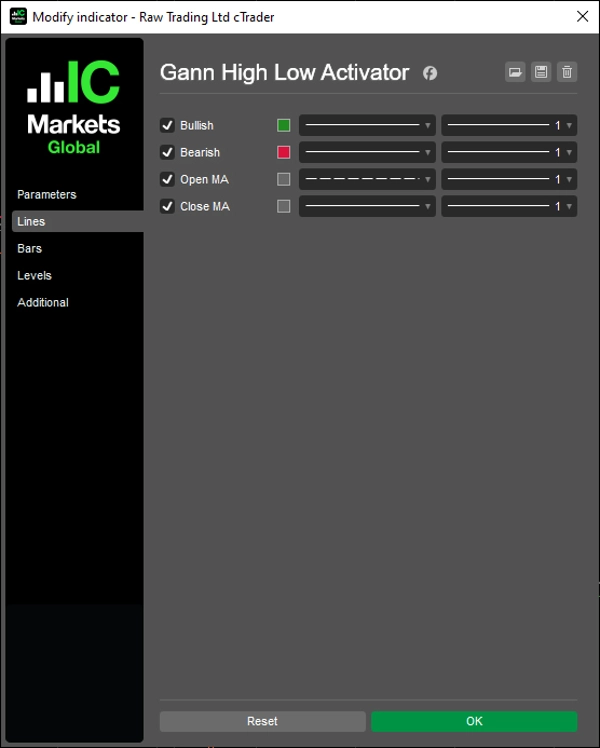
  • ควบคุมสี ความหนา และสไตล์แยกต่างหากสำหรับแต่ละเส้นผลลัพธ์
  • สลับการมองเห็นจะสร้างส่วนทั้งหมดใหม่โดยอัตโนมัติ — ไม่มีวัตถุเก่า
  • ส่วนการฉายขยายส่วน HTF ล่าสุดไปข้างหน้าอีกหนึ่งแท่งเพื่อการคาดการณ์

การปรับแต่งเต็มรูปแบบ

  • กำหนดประเภทและช่วงเวลาของ MA ได้
  • สไตล์เส้นผลลัพธ์แต่ละเส้นสืบทอดโดยวัตถุเส้นแนวโน้มในโหมดเส้นแนวโน้ม
  • กลับไปยังกรอบเวลาปัจจุบันอย่างสะอาดเมื่อ HTF ≤ กรอบเวลาชาร์ต
  • ควบคุมความยาวเส้นสำหรับการจัดการช่วงการแสดงผล
  • แผง UI บนชาร์ตสำหรับปรับพารามิเตอร์ขณะรันไทม์โดยไม่ต้องเปิดการตั้งค่า

ความยาวเส้น

  • ควบคุมว่าจะแสดงเส้นย้อนหลังไปไกลแค่ไหน — ตั้งแต่ Hour8 ถึง Year10
    ใช้กับทุกโหมด: ผลลัพธ์ชุดข้อมูลและวัตถุเส้นแนวโน้ม

การควบคุม UI

  • แผงคอมโบบ็อกซ์บนชาร์ตสำหรับเข้าถึงอย่างรวดเร็วไปยังประเภท MA, โหมด MTF, การคำนวณ, กรอบเวลา และความยาวเส้น
  • ตำแหน่งที่กำหนดได้: มุมบนซ้าย, มุมบนขวา, มุมล่างซ้าย, มุมล่างขวา หรือ ซ่อน (ไม่มี)


__________________________________________________________________________________________


ตัวชี้วัดฟรีเพิ่มเติม


สำรวจเครื่องมือวิเคราะห์ตลาดหลากหลายประเภท — ตั้งแต่โครงสร้างและปริมาณไปจนถึงการถดถอย ความผันผวน และกรอบเวลาที่กำหนดเอง

ซอร์สโค้ดมีให้บน GitHub repository.

ทั้งหมดใช้ฟรี แต่ถ้าคุณต้องการสนับสนุนด้วยกาแฟ คุณสามารถส่งได้ ที่นี่.


แนวรับ/แนวต้าน


ปริมาณ


ค่าเฉลี่ยเคลื่อนที่


ยูทิลิตี้/กำหนดเอง


แบบถดถอย


ความผันผวน


ออสซิลเลเตอร์


__________________________________________________________________________________________


ข้อจำกัดความรับผิดชอบ

การเทรดมีความเสี่ยง ตัวชี้วัดนี้มีไว้สำหรับการวิเคราะห์ทางเทคนิคเท่านั้น — โปรดใช้การจัดการความเสี่ยงอย่างเหมาะสมและเทรดอย่างรับผิดชอบเสมอ


ข้อเสนอแนะ & การปรับปรุง

หากคุณมีข้อเสนอแนะ คำขอฟีเจอร์ หรือไอเดียสำหรับการปรับปรุง โปรดฝากความคิดเห็นในแท็บ Discussion ข้อเสนอแนะของคุณช่วยพัฒนาตัวชี้วัดให้ดีขึ้นสำหรับทุกคน

สรุป

สรุปโดย AI
Gann High Low Activator is a moving average–based trend indicator designed for multi-timeframe analysis on cTrader. It monitors market direction by comparing the close price against moving averages of the High and Low over a configurable period. The indicator switches to a bullish state when the close crosses above the MA of the High, plotting the MA of the Low as dynamic support, and to a bearish state when the close crosses below the MA of the Low, plotting the MA of the High as dynamic resistance.
Key features include four multi-timeframe calculation modes—None (single timeframe), Interpolated (smoothed higher timeframe values), ScaledPeriod (period scaled by timeframe ratio), and Trendline (trendline objects between higher timeframe bars with style control). It supports all cTrader MA types (SMA, EMA, DEMA, TEMA, WMA, etc.) and offers Open and Close MA outputs for additional analysis.
Timeframe resolution options allow manual or automatic selection of higher timeframes based on customizable token patterns. Trendline mode provides independent styling and projects the trendline forward by one bar for anticipation. The indicator includes extensive customization for MA type, period, line styles, display length, and an on-chart UI panel for runtime parameter adjustments. It is suitable for traders applying trend-following techniques across multiple symbols and timeframes.
โปรไฟล์อินดิเคเตอร์
หมวดหมู่อินดิเคเตอร์
Trend
ประเภทเอาต์พุต
การแสดงเป็นภาพ
ข้อกำหนดด้านข้อมูล
แท่งเท่านั้น
สัญญาณที่รองรับ
Reversal

รีวิวจากลูกค้า

0.0
รีวิว: 0
รีวิวจากลูกค้า
ยังไม่มีรีวิวสำหรับผลิตภัณฑ์นี้ หากเคยลองแล้ว ขอเชิญมาเป็นคนแรกที่บอกคนอื่น!

การสนทนา

คำถามที่พบบ่อย

BTCUSD
EURUSD
GBPUSD
NZDUSD
XAUUSD
NAS100
USDJPY
ผลิตภัณฑ์ที่มีให้บริการผ่าน cTrader Store รวมถึงบอทการเทรด อินดิเคเตอร์ และปลั๊กอิน มีให้บริการโดยนักพัฒนาบุคคลที่สามและมีไว้เพื่อวัตถุประสงค์ในการเข้าถึงข้อมูลและทางเทคนิคเท่านั้น cTrader Store ไม่ใช่โบรกเกอร์และไม่ได้ให้คำแนะนำการลงทุน คำแนะนำส่วนบุคคล หรือการรับประกันผลการดำเนินงานในอนาคต

เพิ่มเติมจากผู้เขียนคนนี้

อินดิเคเตอร์
VWAP
Customizable VWAP with flexible reset, three band methods, and full Fibonacci level control.
อินดิเคเตอร์
Fibonacci
Fair Value Gap
Detect FVGs with age, status, Fibonacci levels, and customizable fill threshold—extended version.
อินดิเคเตอร์
Fibonacci
Clear pivot levels. Clean S/R zones. Five methods. Any timeframe.
อินดิเคเตอร์
Forex
Crypto
+3
Volume distribution analysis with Market Profile TPO integration.
อินดิเคเตอร์
Forex
Crypto
+3
Custom and native timeframes display with OHLC lines, moving averages, and Fibonacci levels.
อินดิเคเตอร์
Forex
Crypto
+3
VSA indicator analyzing volume, spread, and close location to detect supply/demand imbalances.
อินดิเคเตอร์
Breakout
Fibonacci
Track Initial Balance ranges across any period with optional Fibonacci levels and projections.
อินดิเคเตอร์
Forex
Crypto
+3
28-method MA library in one indicator — from classic EMAs to adaptive & zero-lag variants.
อินดิเคเตอร์
Breakout
Plots automatic psychological levels at round-number zones – major structure & liquidity levels.
อินดิเคเตอร์
Breakout
Fibonacci
Statistically-grounded trend channels via linear regression — clear trend & reversal zones.
อินดิเคเตอร์
Forex
Crypto
+3
John Ehlers' trendline using signal processing to filter cycle noise and identify trends with minimal lag.
อินดิเคเตอร์
Forex
Crypto
+3
Volume profiler applying Wyckoff effort vs result and spread analysis with visual bar graphs.

นอกจากนี้คุณยังอาจชอบ

"Hull Moving Average Colored" โลโก้
ยอดนิยม
4.0
(1)
$19
อินดิเคเตอร์
Forex
BTCUSD
+8
The traditional Hull Moving Average with different colours based on the slope (direction) of the trend.
อินดิเคเตอร์
AI
Forex
+3
Smart Money FVG & Imbalance Detector – Precision Institutional Tool
อินดิเคเตอร์
ATR
CCI
+5
An institutional-grade trading system fusing triple hybrid moving averages, multi-oscillator momentum filters, Fair Valu
อินดิเคเตอร์
The long awaited new and improved Supply Demand Premium V2 indicator. Unlock greater trading opportunities now!
อินดิเคเตอร์
ATR
Prop
+7
Smart momentum tool uses advanced filtering and colour cues for clearer market direction and trading signals.
"MGC Trend Analysis 1.4" โลโก้
ยอดนิยม
4.6
(3)
$25
/
$50
อินดิเคเตอร์
Forex
BTCUSD
+5
Trend analysis, automatic analysis, position, swingtrader, scalper
อินดิเคเตอร์
BOS
MSS
+3
Maps BOS, CHoCH, swing breaks and market structure shifts directly on your cTrader chart.
อินดิเคเตอร์
BOS
Imbalance
+4
Automatically detects and highlights both Bullish and Bearish Fair Value Gaps (FVGs).
อินดิเคเตอร์
RSI
Breakout
+1
Dynamically adjusts regression channels based on ZigZag extremes, resetting when price breaks bands to track real trends
"ZigzagSR" โลโก้
ยอดนิยม
4.3
(3)
$19
/
$30
อินดิเคเตอร์
RSI
XAUUSD
+2
Automatic ZigZag swings with dynamic support & resistance levels, labeling highs/lows for clear trend signals.
อินดิเคเตอร์
Supply and demand zones. They're important. Here's a free version to get you started!
อินดิเคเตอร์
RSI
MACD
+7
The ZigZag indicator is a technical analysis tool primarily used to identify key price reversal points.
อินดิเคเตอร์
Shows daily and sessions highs / lows and session boxes, everything configurable
อินดิเคเตอร์
Signal
Cumulative Volume Delta tracks the net difference in tick volume between buying and selling pressure over time
อินดิเคเตอร์
RSI
EURUSD
+2
It identifies areas of market imbalance (Fair Value Gaps or FVGs) and projects them on the chart in a smart way
อินดิเคเตอร์
This is the first version I offer you for free.
อินดิเคเตอร์
News Filter
External Data
+3
Real-time financial news and economic calendar overlay for cTrader with smart alerts
อินดิเคเตอร์
Order Block
Fair Value Gap
+3
This indicator scans multi-timeframe trend confluence and price action triggers within key supply/demand zones

ราคา

ตั้งแต่ 20/12/2024
7.92K
ติดตั้งฟรี