설명
Pinescriptlabs 스토어 지표: Pinescriptlabs 스토어 cBots : (cBot) Gold & BTC BreakoutSession Pivots(new)
Prediction Based on Linreg & ATR
SmartTrend Support &
Resistance
Lines
Dynamic
Market Structure
Analysis
of
Turning
Points
Fibonacci
Linear
Regression
Multi-timeframe
Multi-Level
Candle Bias
Tracker
Auto
Support and
Resistance
Trend
Lines
All
Support and
Resistance
Levels
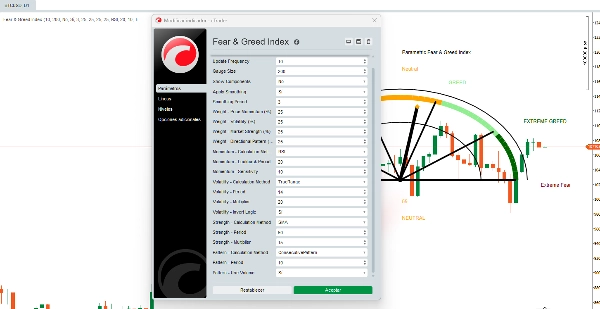
Fear & Greed Index
이 Fear & Greed 지표는 시장 심리를 0-100 값으로 종합하는 고급 시각 알고리즘으로, 반원형 게이지를 사용합니다. 기본 버전과 달리 이 도구는 완전히 사용자 정의 가능하여 트레이더가 계산의 모든 측면을 조정할 수 있습니다.
📊 4가지 핵심 구성 요소 (구성 가능)
1️⃣ 가격 모멘텀 *(구성 가능 가중치: 0-100%)*
6가지 계산 방법 제공:
- PriceChange: 이전 기간 대비 단순 % 변화
- ROC: 정규화된 변화율
- RSI: 모멘텀을 위한 수정된 RSI
- SMADeviation: SMA로부터의 가격 편차
- EMADeviation: EMA로부터의 가격 편차
- MACD: 모멘텀 지표로서의 MACD 신호
🔧 사용자 정의 가능한 매개변수:
- 조회 기간 *(5-100)*
- 계산 민감도 *(1.0-50.0)*
2️⃣ 변동성 *(구성 가능 가중치: 0-100%)*
6가지 계산 방법 제공:
- TrueRange: True Range 기반 변동성
- HighLowRange: 단순 고가-저가 범위
- CloseToClose: 로그 기반 종가 간 변동성
- ATR: 표준 평균 진폭 범위
- StandardDev: 가격 표준 편차
- ParkinsonVol: Parkinson 변동성 추정기
🔧 사용자 정의 가능한 매개변수:
- 계산 기간 *(5-50)*
- 변동성 배수 *(1.0-100.0)*
- 논리 반전 (변동성 증가 = 공포 증가)
3️⃣ 시장 강도 *(구성 가능 가중치: 0-100%)*
6가지 계산 방법 제공:
- SMA: 단순 이동 평균 대비 위치
- EMA: 지수 이동 평균 대비 위치
- VWAP: 거래량 가중 평균 가격 대비 위치
- HLBand: 고가-저가 밴드 내 위치
- BollingerPos: 볼린저 밴드 내 위치
- PivotDistance: 피벗 포인트까지 거리
🔧 사용자 정의 가능한 매개변수:
- 계산 기간 *(10-200)*
- 강도 배수 *(1.0-50.0)*
4️⃣ 방향성 패턴 *(구성 가능 가중치: 0-100%)*
6가지 계산 방법 제공:
- BullBearRatio: 강세/약세 캔들 비율
- VolumePattern: 거래량 추세 분석
- BodySizePattern: 캔들 몸통 크기 분석
- WickPattern: 꼬리 패턴 분석
- GapPattern: 갭 감지 및 분석
- ConsecutivePattern: 연속 가격 움직임 분석
🔧 사용자 정의 가능한 매개변수:
- 분석 기간 *(5-30)*
- 계산에 사용되는 거래량 (선택 사항)
⚙️ 고급 기능
🔹 유연한 가중치 시스템
- 구성 요소별 맞춤 가중치 *(0-100%)*
- 가중치 합이 100%가 아닐 경우 자동 정규화
- 비최적 구성에 대한 경고
🔹 스마트 스무딩
- 노이즈 감소를 위한 선택적 스무딩
- 조정 가능한 스무딩 기간 *(1-10)*
- 최종 결과에 적용되는 SMA 필터
🔹 완전 사용자 정의 가능한 디스플레이
- 게이지 크기 *(50-500px)*
- 업데이트 빈도 *(1-50 바)*
- 선택적 구성 요소 분해 (개별 값 표시)
- 기기 및 시간대에 자동 적응
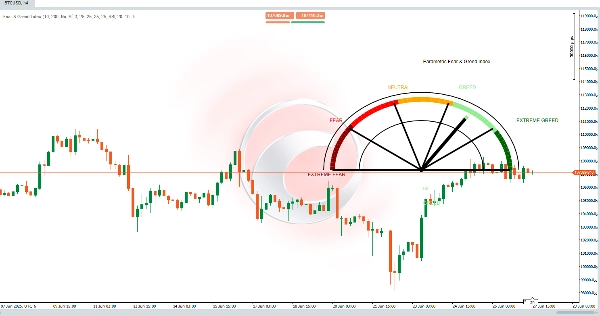
🔄 알고리즘 프로세스
4단계: 시각화
반원형 게이지는 5가지 색상 구역을 표시합니다:
- 0-20: 극도의 공포
- 21-40: 공포
- 41-60: 중립
- 61-80: 탐욕
- 81-100: 극도의 탐욕
✅ 완전 사용자 정의 가능한 시스템:
🎯 완전한 유연성
- 모든 시장에 적응: 외환, 암호화폐, 주식, 원자재
- 시간대별 특화: 스캘핑과 스윙 트레이딩에 따른 다른 설정
- 시장 변화에 따른 전략 조정
요약
고객 리뷰
5 | 100 % | |
4 | 0 % | |
3 | 0 % | |
2 | 0 % | |
1 | 0 % |