Penerangan
🚀 Lebih 10,000 pedagang sudah menggunakan penunjuk TERBAIK kami 🏆
Temui mengapa profesional memilih kami – alat paling berkuasa di cTrader (penunjuk, algoritma, dan cBots) menanti anda.
👉 Dapatkan semua sistem TERBAIK kami di sini:
_______________________________________________
📌 Penunjuk Struktur Pasaran
· ✅ AdvancedMarket Structure: Bos, Choch, SwinLevels, Order Blocks, Struktur Pasaran& Pencari Kecairan
· 🔄 Analisis Struktur Pasaran Dinamik Titik Pusingan
· 🧱 Blok Pesanan
· ⚖️ Ketidakseimbangan Pasaran
· ⛓️ BOS & CHOCH
· 🧠 Kuasa ICT 3
_______________________________________________
🔚 Sistem Keluar Pintar
_______________________________________________
📐 Penunjuk ZigZag
· 🔍 Unjuran Kecairan Harga ZigZag
· ➖ ZigZag
· 🎯 Penjejak Extremity Zig-Zag
_______________________________________________
🧱 Penunjuk Sokongan & Rintangan
· 🟩 Garis Sokongan & Rintangan SmartTrend
· 🧱 Semua Tahap Sokongan dan Rintangan
_______________________________________________
📊 Penunjuk Trend & Saluran
· 📊 Supertrend
· ⚡Penganalisis Trend Momentum
_______________________________________________
💧 Alat Isipadu & Kecairan
· 🔍 Jurang Nilai Adil Momentum
_______________________________________________
⚡ Penunjuk Momentum & RSI
· 🔎 Penjejakan Bias Lilin Berbilang Tahap
Tracker
_______________________________________________
🔮 Alat Ramalan & Unjuran
· 📐 Ramalan Berdasarkan Linreg& ATR
· 📏 Regresi Linear Fibonacci Multi-masa
· 📈 Pemproyektor Aliran Pasaran Digerakkan Isipadu
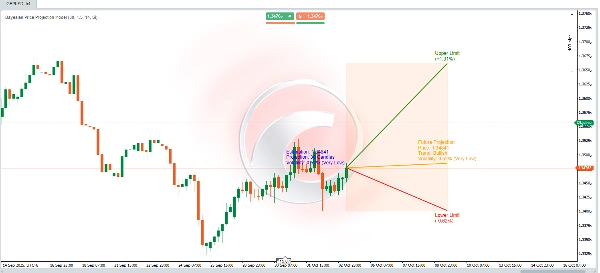
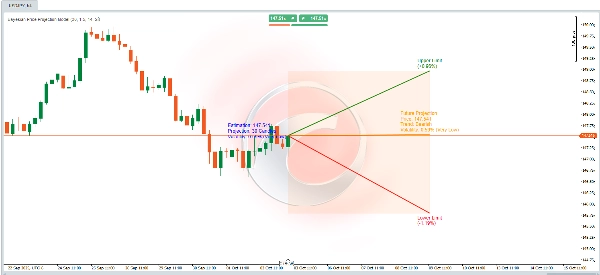
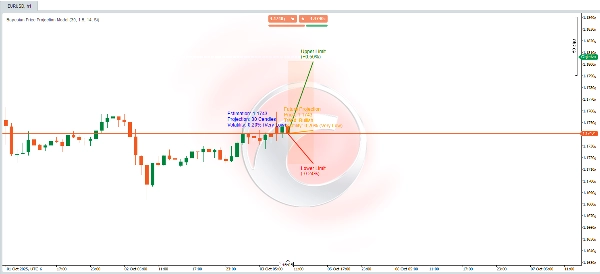
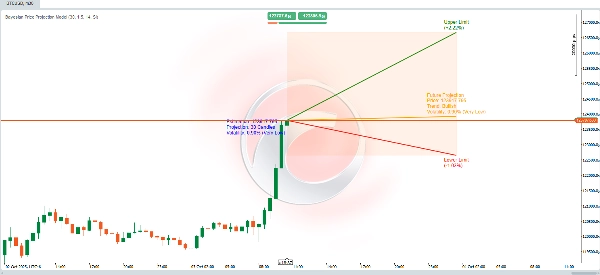
📊 Algoritma Unjuran Harga Dinamik 📈
Algoritma ini menggabungkan **pengiraan statistik**, **analisis teknikal**, dan **teori Bayesian** untuk meramalkan harga masa depan sambil menyediakan **julat ketidakpastian** yang mewakili had atas dan bawah. Pengiraan direka untuk melaraskan unjuran dengan mengambil kira **trend** pasaran, **volatiliti**, dan kebarangkalian sejarah mencapai paras tertinggi atau terendah baru.
Berikut adalah cara ia berfungsi:
🚀 Unjuran Harga Masa Depan
Pengiraan dinamik menganggarkan harga masa depan berdasarkan tiga elemen utama:
1. **Trend**: Menentukan sama ada pasaran cenderung bergerak naik atau turun.
2. **Volatiliti**: Mengukur besarnya perubahan yang dijangka berdasarkan turun naik sejarah.
🧠 **Pelarasan Kebarangkalian Bayesian**
- Kebarangkalian bersyarat dikira menggunakan **formula Bayes**:
\[
P(A|B) = \frac{P(B|A) \cdot P(A)}{P(B)}
\]
Ini memodelkan peristiwa masa depan menggunakan maklumat bersyarat:
- **Kebarangkalian mencapai paras tertinggi sepanjang masa baru** jika harga sedang tren naik.
- **Kebarangkalian mencapai paras terendah sepanjang masa baru** jika harga sedang tren turun.
- Kebarangkalian ini memperhalusi anggaran harga masa depan dengan mengambil kira:
- **Volatiliti lebih tinggi** meningkatkan kemungkinan mencapai paras ekstrem (tinggi/rendah).
- **Trend pasaran** mempengaruhi arah pergerakan harga yang dijangka.
🌟 **Pengiraan Volatiliti**
- Volatiliti diukur menggunakan penunjuk **ATR (Average True Range)** dengan tetingkap 14 tempoh. Ini mencerminkan purata amplitud turun naik harga.
- Untuk menyatakan volatiliti sebagai peratusan, ATR dinormalisasi dengan membahagikannya dengan harga penutupan dan mendarabkannya dengan 200.
- Volatiliti kemudian dikategorikan ke dalam tahap deskriptif (contohnya, **Sangat Rendah**, **Rendah**, **Sederhana**, dan lain-lain) untuk tafsiran yang lebih baik.
---
🎯 **Had Penyimpangan (Atas dan Bawah)**
- Had atas dan bawah membentuk **julatan unjuran** di sekitar harga masa depan yang dianggarkan, menyediakan kerangka kerja untuk ketidakpastian.
- Had ini dikira dengan melaraskan ATR menggunakan:
- **Pengganda** yang ditentukan pengguna (`factor_desviacion`).
- **Kebarangkalian Bayesian** yang dikira sebelum ini.
- **Punca kuasa dua tempoh unjuran** (`proyeccion_dias`), yang menggabungkan prinsip bahawa ketidakpastian meningkat dari masa ke masa.
🔍 **Mentafsir Model**
Ini boleh dilihat sebagai **model kebarangkalian dinamik** yang:
- Menggabungkan **analisis teknikal** (trend dan ATR).
- Memperhalusi kebarangkalian menggunakan **teori Bayesian**.
- Menyediakan **julatan unjuran visual** untuk membantu anda memahami potensi pergerakan harga masa depan dan ketidakpastian yang berkaitan.
⚡ Sama ada anda menganalisis **pasaran yang tidak stabil** atau mengesahkan **senario bullish/bearish**, alat ini membekalkan anda dengan pendekatan berasaskan data yang kukuh! 🚀