Beschreibung
Pinescriptlabs Store Indikatoren: Pinescriptlabs Store cBots : (cBot) Gold & BTC BreakoutSession Pivots(neu)
Vorhersage basierend auf Linreg & ATR
SmartTrend Unterstützung &
Widerstand
Linien
Dynamische
Marktstruktur
Analyse
von
Wendepunkten
Punkten
Fibonacci
Lineare
Regression
Multi-Zeitrahmen
Mehrstufig
Kerzen-Bias
Tracker
Reaktive gleitende Durchschnittslinie
Auto
Unterstützungs- und
Widerstandstrend
Linien
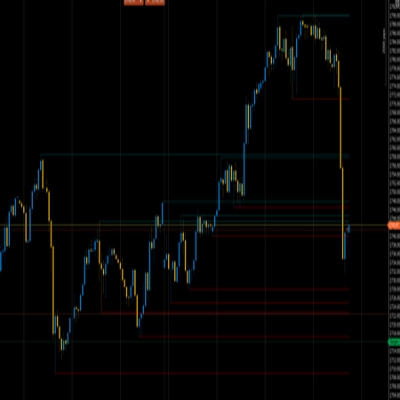
Alle
Unterstützungs- und
Widerstandsniveaus
Levels
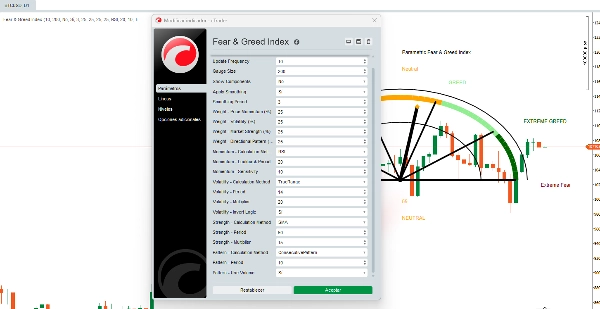
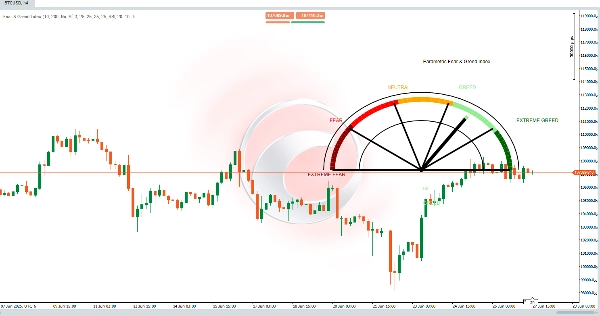
Angst- & Gier-Index
Der Angst- & Gier-Indikator ist ein fortschrittlicher visueller Algorithmus, der die Marktstimmung in einen 0-100 Wert mithilfe eines halbkreisförmigen Messgeräts zusammenfasst. Im Gegensatz zu einfachen Versionen ist dieses Tool vollständig anpassbar und ermöglicht es Händlern, jeden Aspekt seiner Berechnung zu verändern.
📊 Die 4 Kernkomponenten (konfigurierbar)
1️⃣ Preis-Momentum *(Konfigurierbares Gewicht: 0-100%)*
6 Berechnungsmethoden verfügbar:
- PriceChange: Einfache prozentuale Veränderung gegenüber dem vorherigen Zeitraum
- ROC: Normalisierte Änderungsrate
- RSI: Modifizierter RSI für Momentum
- SMADeviation: Preisabweichung vom SMA
- EMADeviation: Preisabweichung vom EMA
- MACD: MACD-Signal als Momentum-Indikator
🔧 Anpassbare Parameter:
- Lookback-Periode *(5-100)*
- Berechnungsempfindlichkeit *(1.0-50.0)*
2️⃣ Volatilität *(Konfigurierbares Gewicht: 0-100%)*
6 Berechnungsmethoden verfügbar:
- TrueRange: Volatilität basierend auf True Range
- HighLowRange: Einfacher Hoch-Tief-Bereich
- CloseToClose: Logarithmische Close-to-Close-Volatilität
- ATR: Standard Average True Range
- StandardDev: Preis-Standardabweichung
- ParkinsonVol: Parkinson-Volatilitätsschätzer
🔧 Anpassbare Parameter:
- Berechnungsperiode *(5-50)*
- Volatilitätsmultiplikator *(1.0-100.0)*
- Logikumkehr (höhere Volatilität = mehr Angst)
3️⃣ Marktstärke *(Konfigurierbares Gewicht: 0-100%)*
6 Berechnungsmethoden verfügbar:
- SMA: Position relativ zum einfachen gleitenden Durchschnitt
- EMA: Position relativ zum exponentiellen gleitenden Durchschnitt
- VWAP: Position relativ zum volumengewichteten Durchschnittspreis
- HLBand: Position innerhalb des Hoch-Tief-Bandes
- BollingerPos: Position innerhalb der Bollinger-Bänder
- PivotDistance: Abstand zu Pivot-Punkten
🔧 Anpassbare Parameter:
- Berechnungsperiode *(10-200)*
- Stärkefaktor *(1.0-50.0)*
4️⃣ Richtungsmuster *(Konfigurierbares Gewicht: 0-100%)*
6 Berechnungsmethoden verfügbar:
- BullBearRatio: Verhältnis von bullischen zu bärischen Kerzen
- VolumePattern: Volumentrendanalyse
- BodySizePattern: Analyse der Kerzenkörpergröße
- WickPattern: Analyse des Dochtmusters
- GapPattern: Lücken-Erkennung & Analyse
- ConsecutivePattern: Analyse aufeinanderfolgender Kursbewegungen
🔧 Anpassbare Parameter:
- Analysezeitraum *(5-30)*
- Volumennutzung in Berechnungen (optional)
⚙️ Erweiterte Funktionen
🔹 Flexibles Gewichtungssystem
- Benutzerdefinierte Gewichte pro Komponente *(0-100%)*
- Automatische Normalisierung, falls Gewichte nicht 100% ergeben
- Warnungen bei suboptimalen Konfigurationen
🔹 Intelligente Glättung
- Optionale Glättung zur Rauschreduzierung
- Anpassbare Glättungsperiode *(1-10)*
- SMA-Filter angewendet auf Endergebnisse
🔹 Vollständig anpassbare Anzeige
- Messgerätgröße *(50-500px)*
- Aktualisierungsfrequenz *(1-50 Balken)*
- Optionale Komponentenaufschlüsselung (zeigt einzelne Werte)
- Passt sich automatisch an Instrument & Zeitrahmen an
🔄 Algorithmusprozess
Schritt 4: Visualisierung
Das halbkreisförmige Messgerät zeigt 5 Farbzonen:
- 0-20: Extreme Angst
- 21-40: Angst
- 41-60: Neutral
- 61-80: Gier
- 81-100: Extreme Gier
✅ Vollständig anpassbares System:
🎯 Totale Flexibilität
- Passt sich jedem Markt an: Forex, Krypto, Aktien, Rohstoffe
- Zeitrahmen-spezifisch: Unterschiedliche Einstellungen für Scalping vs. Swing Trading
- Entwickelt sich mit dem Markt: Strategien anpassen, wenn sich die Bedingungen ändern
Zusammenfassung
Kundenbewertungen
5 | 100 % | |
4 | 0 % | |
3 | 0 % | |
2 | 0 % | |
1 | 0 % |