Opis
Wskaźniki Pinescriptlabs Store: Pinescriptlabs Store cBots : (cBot) Gold & BTC BreakoutSession Pivots(nowy)
Trailing Smart Algorithm (Nowy)
Prognoza oparta na Linreg & ATR
SmartTrend Wsparcie &
Opór
Linie
Dynamiczna
Struktura Rynku
Analiza
punktów
zwrotnych
Punktów
Fibonacci
Regresja
Liniowa
Wielookresowa
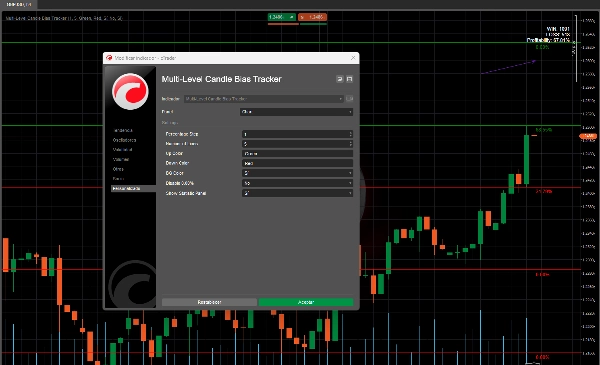
Wielopoziomowy
Tracker Kierunku Świec
Tracker
Auto
Wsparcie i
Opór
Linie Trendu
Linie
Wszystkie
Poziomy Wsparcia i
Opór
Poziomy
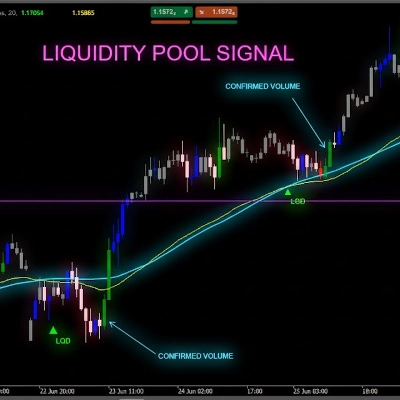
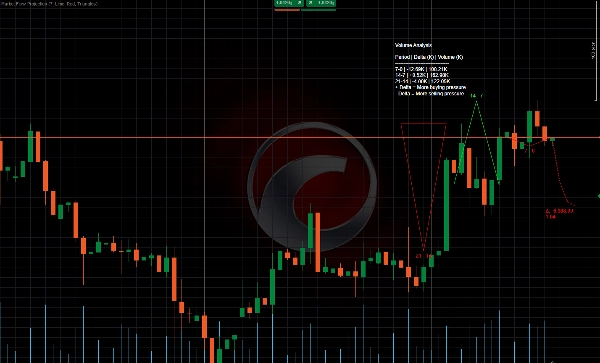
Ten algorytm określa prawdopodobieństwo osiągnięcia przez cenę nowego maksimum lub minimum i przedstawia je jako poziom na wykresie, wraz z odpowiadającym mu procentem. Obliczenia są testowane historycznie, a wyniki wyświetlane w tabeli, co ułatwia zrozumienie prawdopodobieństwa, że następna świeca ustanowi nowe maksimum lub minimum. 📈📉
Jak to działa? 🛠️
- Prawdopodobieństwa nowych maksimów i minimów 🎯
-
- Algorytm analizuje przeszłe zachowanie ceny, aby obliczyć prawdopodobieństwo, że cena osiągnie nowe maksimum lub minimum w następnej świecy.
- Na przykład, jeśli prawdopodobieństwo nowego maksimum wynosi 70%, to bardziej prawdopodobne jest, że cena wzrośnie. ⬆️
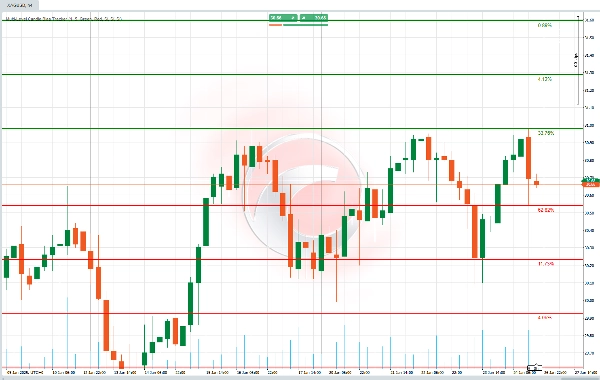
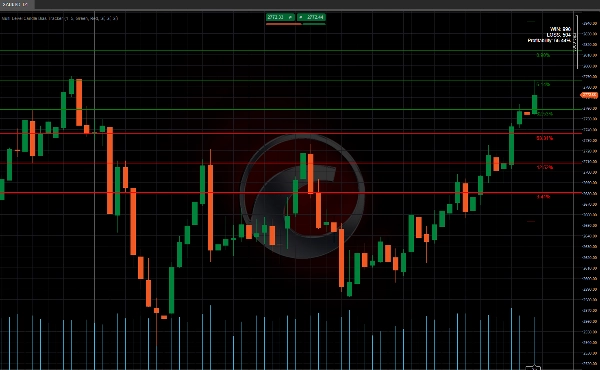
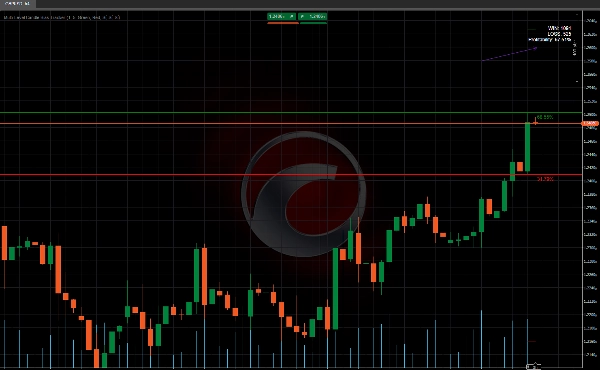
- Poziomy z procentami 📏
-
- Rysuje poziome linie na wykresie reprezentujące kluczowe poziomy, wraz z procentem wskazującym prawdopodobieństwo osiągnięcia tego poziomu przez cenę.
- Te poziomy są obliczane za pomocą procentu który definiujesz (np. 1%).
- Panel statystyk 📊
-
- Pokazuje, ile razy cena osiągnęła te poziomy (sukcesy) i ile razy nie.
- Daje także procent skuteczności, informujący, czy te poziomy były wiarygodne w przeszłości. ✅❌
Do czego to służy?
- Zrozumienie kierunku ceny: Pomaga zrozumieć, czy cena prawdopodobnie wzrośnie czy spadnie w następnej świecy. ⬆️⬇️
- Zarządzanie ryzykiem: Jeśli poziom ma niskie prawdopodobieństwo, możesz go unikać, aby zmniejszyć ryzykowne decyzje.
Jak go używać?
- Obserwuj poziomy: Spójrz na linie, które algorytm rysuje na wykresie. 👀
- Sprawdź prawdopodobieństwa: Jeśli poziom ma wysokie prawdopodobieństwo (np. 70%), to bardziej prawdopodobne, że cena go osiągnie. 📈
- Użyj panelu statystyk: Sprawdź, czy te poziomy dobrze działały w przeszłości, aby zdecydować, czy im ufasz. 📊
Podsumowanie
The indicator includes a statistics panel that shows how many times the price has successfully reached these levels versus how many times it has not, along with an effectiveness percentage reflecting the reliability of these levels based on historical data.
This tool is designed to help traders understand the likely direction of price movement in the next candle and manage risk by avoiding levels with low probabilities. Users apply it by observing the drawn levels, checking their associated probabilities, and reviewing the statistics panel to assess the historical performance of these signals.
Supported markets include commodities, cryptocurrencies (e.g., BTCUSD), and other symbols. The indicator integrates probability-based analysis into price action trading to assist in decision-making regarding potential breakout or trend continuation scenarios.
Opinie klientów
5 | 100 % | |
4 | 0 % | |
3 | 0 % | |
2 | 0 % | |
1 | 0 % |