Beschreibung
🔥 Pinescritlabs
Ctrader Store Indikatoren: 🤖Pinescritlabs Ctrader Store cBots:
Fair Value Gap Sessions Gold & BTC Breakout Session Pivots
Dynamische Marktstruktur
Analyse von Wendepunkten
Fibonacci Linear
Regression Multi-Zeitrahmen
Multi-Level Kerzen-Bias
Tracker
Reaktive Gleitender Durchschnitt
Auto Support und
Resistance Trend Lines
Alle Unterstützungs- und
Widerstandsniveaus
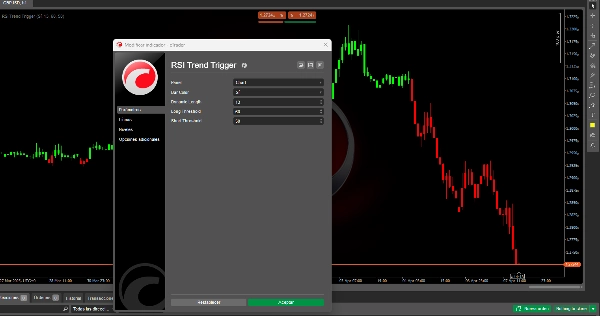
RSI Trend Trigger 📈✨
Wie funktioniert es? 🤔
Schritt 1: Traditioneller RSI
Der Standard-Relative Strength Index (RSI) wird berechnet und misst die Geschwindigkeit und das Ausmaß der Kursbewegungen über einen festgelegten Zeitraum. Er oszilliert zwischen 0 und 100 und identifiziert überkaufte Zustände (z. B. über 70) und überverkaufte Zustände (z. B. unter 30). 📊📉📈
Schritt 2: Dynamische Verfeinerung
Der traditionelle RSI durchläuft einen fortgeschrittenen Glättungsprozess:
- Eine zweite mathematische Berechnung wird auf die ursprünglichen RSI-Werte angewendet (nicht auf den Preis selbst).
- Dieser Schritt erzeugt eine stabilere Version des RSI, reduziert kleinere Schwankungen (Marktrauschen) und hebt echte Trends hervor.
- Im Gegensatz zur einfachen Glättung bleibt die Reaktionsfähigkeit auf bedeutende Momentumverschiebungen erhalten, wodurch übermäßige Verzögerungen vermieden werden. 🛡️🔄
Warum ist die Verfeinerung wichtig? 🤩
- Intelligente Filterung: Eliminierung falscher Signale, die durch vorübergehende Volatilität verursacht werden, wie Nachrichten-Spikes oder spekulative Bewegungen. �🗑️
- Klarere Trends: Der doppelte Berechnungsansatz unterscheidet zwischen kleinen Korrekturen und echten Trendwenden. 🎯
- Beständige Signale: Sobald ein Trend (bullisch/bärisch) bestätigt ist, hält der Indikator diesen, bis eine klare Umkehr erfolgt, und vermeidet sprunghafte Signalwechsel. 🔒
Praktische Anwendung: Schwellenwerte & Entscheidungsfindung 📈
Der verfeinerte RSI kombiniert sich mit zwei einstellbaren Schwellenwerten:
- Bullische Schwelle (z. B. 60):
-
- Wenn der verfeinerte RSI diesen Wert überschreitet, wird ein bullischer Trend bestätigt. 🚀
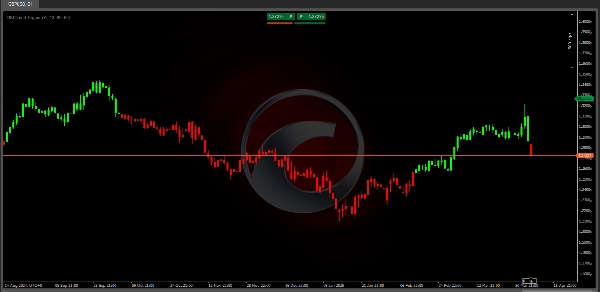
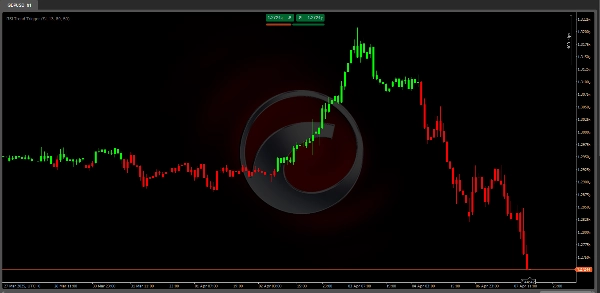
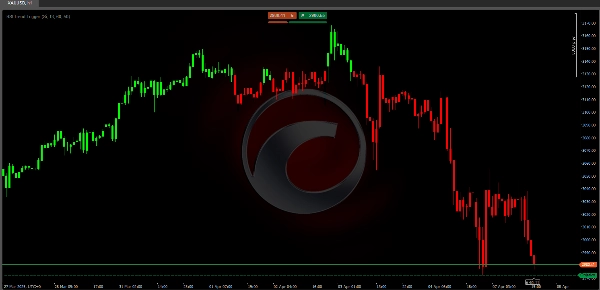
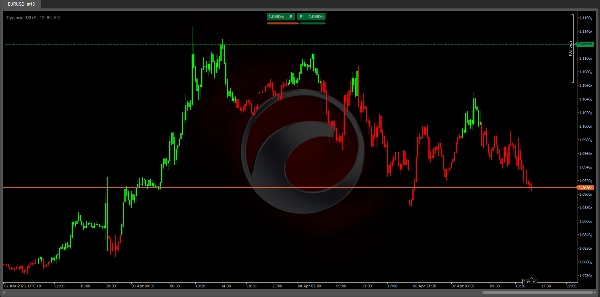
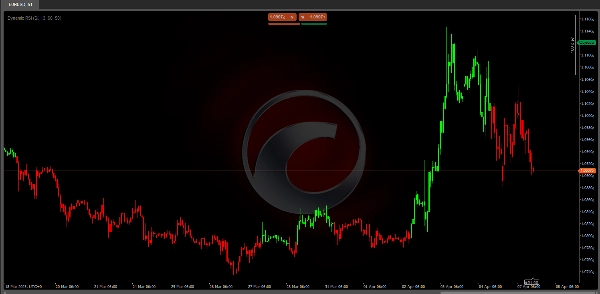
- Kerzen werden grün
- Bärische Schwelle (z. B. 50):
-
- Wenn der verfeinerte RSI unter diesen Wert fällt, wird ein bärischer Trend ausgelöst. 📉
- Kerzen werden rot
Wichtige Regel:
- Signale erscheinen nur bei Trendwechseln (nicht bei jeder Schwankung), wodurch Informationsüberflutung reduziert wird. 🚫📢
- Schwellenwerte sind anpassbar: Verwenden Sie höhere Werte (z. B. 65/55) für volatile Märkte oder niedrigere Werte (z. B. 55/45) für ruhigere Trends. ⚙️
Vorteile für Trader 🏆
- Verbesserte Präzision:
-
- Weniger falsche Signale dank doppellagiger Filterung. Ideal für Seitwärtsmärkte oder Fehlausbrüche. ✅
- Intuitive Visualisierung:
-
- Farbige Kerzen und visuelle Schwellenwerte ermöglichen sofortiges Erkennen von Trends. 👀🎨
- Anpassungsfähigkeit:
-
- Funktioniert über verschiedene Assets (Forex, Aktien, Krypto) und Zeitrahmen (Minuten bis Wochen). 🌍⏳
- Trendfokussierter Handel:
-
- Hilft, mit dem Momentum zu handeln und riskante Gegen-Trend-Bewegungen zu vermeiden. 🎯🚦
Beispiel Signalverlauf
Stellen Sie sich vor, der verfeinerte RSI liegt bei 55 (neutraler Bereich):
- Bullisches Szenario: Steigt auf 62 → Überschreitet die 60er Schwelle → Kerzen werden grün🚀
- Bärisches Szenario: Fällt auf 48 → Unterschreitet die 50er Schwelle → Kerzen werden rot📉
Zusammenfassung
The indicator then applies an advanced smoothing process to the RSI values, not the price data, creating a refined RSI that reduces minor market noise while maintaining sensitivity to significant momentum changes. This dual-layer calculation enhances signal precision by filtering out false signals caused by temporary volatility and distinguishing between minor corrections and genuine trend reversals.
Users can customize two threshold levels—a bullish threshold (e.g., 60) and a bearish threshold (e.g., 50)—to define when a trend is confirmed. When the refined RSI crosses above the bullish threshold, the indicator signals a bullish trend with green candles; when it falls below the bearish threshold, it signals a bearish trend with red candles. Signals appear only during trend changes, reducing information overload.
The RSI Trend Trigger supports multiple timeframes from minutes to weeks and is adaptable to different market conditions, aiding traders in aligning with momentum and avoiding counter-trend risks.
Kundenbewertungen
5 | 67 % | |
4 | 33 % | |
3 | 0 % | |
2 | 0 % | |
1 | 0 % |