

Описание
ОБЗОР
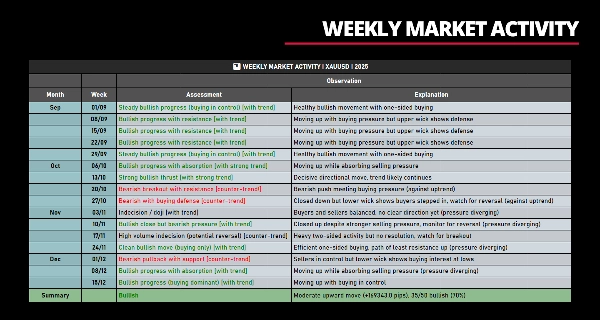
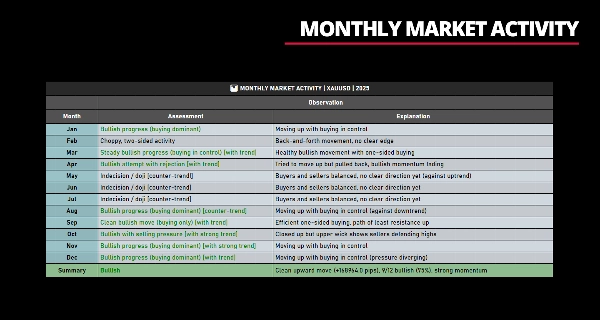
Анализатор эффективности объема — это комплексный инструмент анализа по каждой свече, который измеряет взаимосвязь между объемом (усилием) и движением цены (результатом). Изначально он был создан для личного использования, чтобы ответить на конкретный вопрос: «Двигается ли рынок эффективно или много активности без значимого прогресса?»
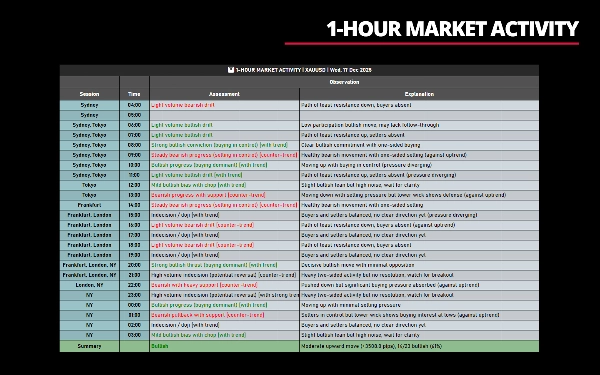
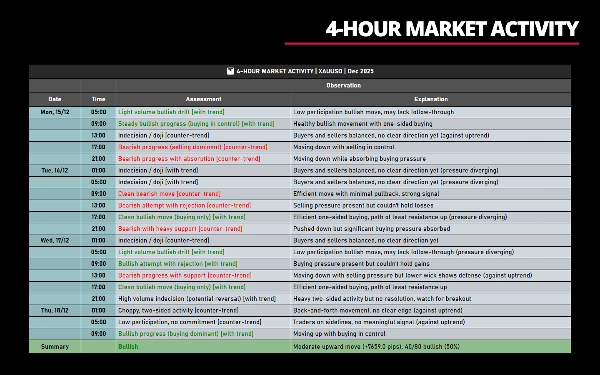
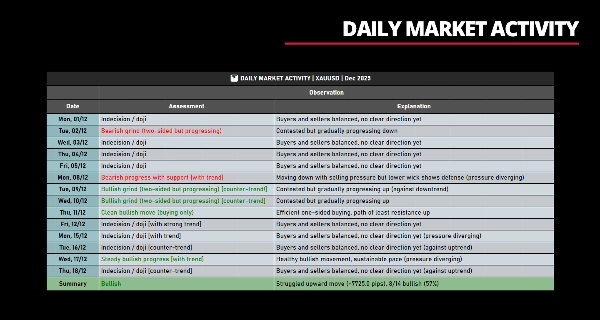
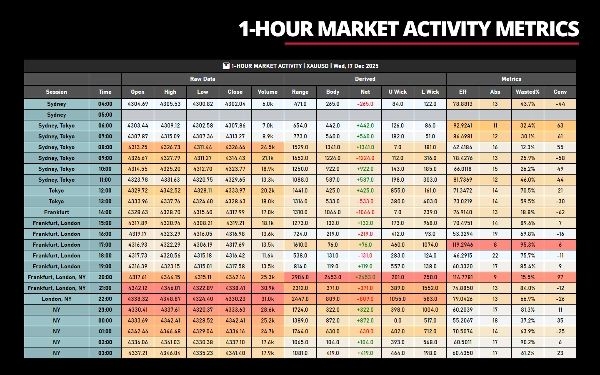
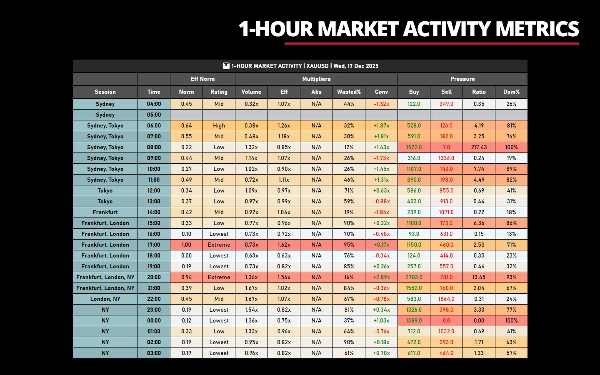
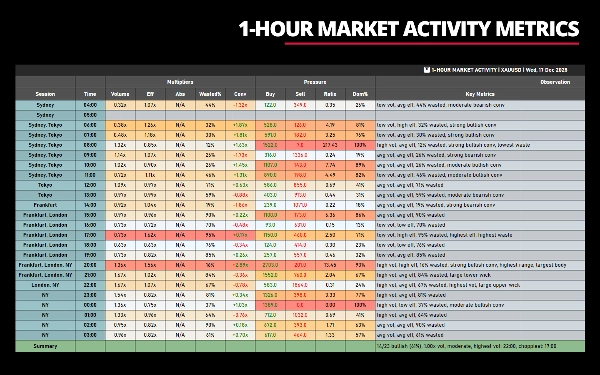
Этот индикатор НЕ выводит графические данные. Он отображает статистический анализ и метрики только в табличном формате — без линий, сигналов или наложений на цену. Эти метрики измеряют и количественно оценивают качество и характеристики ценового действия и поведения рынка, помогая понять, были ли движения решительными, исчерпанными, оспариваемыми или нерешительными — после их совершения.
__________________________________________________________________________________________
НА ПЕРВЫЙ ВЗГЛЯД
Вывод: Статистические данные (без графиков)
Отображение: Табличный формат
Таймфреймы: От субдневных до месячных
Метрики: Более 20 индикаторов эффективности/давления
Лучше всего для: Анализа объема, оценки качества
__________________________________________________________________________________________
ОСНОВНАЯ КОНЦЕПЦИЯ: УСИЛИЕ ПРОТИВ РЕЗУЛЬТАТА
Основная идея проста:
- Усилие = Тиковый объем (торговая активность)
- Результат = Движение цены (диапазон, тело, чистое изменение)
Эффективные рынки создают значительное движение цены при разумном объеме — движения чистые и решительные.
Неэффективные рынки показывают высокий объем, но ограниченный чистый прогресс — движения резкие, оспариваемые или поглощаемые.
Измеряя эту взаимосвязь по отдельным свечам и агрегированным периодам, вы можете определить:
- Трендовые vs. флетовые условия
- Приверженность vs. нерешительность
- Истощение vs. продолжение
- Односторонние vs. двусторонние рынки
__________________________________________________________________________________________
НАСТРОЙКА КЛЮЧЕВЫХ ПАРАМЕТРОВ
Эти пять параметров контролируют какие данные отображает индикатор. Понимание их работы важно для эффективного использования.
1. Параметр даты
Назначение: Определяет, какую дату/период анализировать.
Примеры формата:
""(пусто) – самый последний торговый день с данными"18/12/2025"– конкретная дата (ДД/ММ/ГГГГ)"12/2025"– весь месяц (ММ/ГГГГ)"2025"– весь год (ГГГГ)
2. Параметр временного диапазона
Назначение: Фильтрует, какие часы отображать на субдневных таймфреймах.
Применяется к: Только субдневным таймфреймам (от 1 минуты до 1 часа)
Примеры формата:
""(пусто) – полный 24-часовой торговый день"8-16"– с 8:00 до 16:00"08:00-16:30"– с 8:00 до 16:30"14"– с 14:00 до текущего времени
3. Параметр диапазона недель
Назначение: Фильтрует, какие недели месяца отображать.
Применяется к: Только многочасовым таймфреймам (от 2 до 12 часов)
Примеры формата:
""(пусто) – все недели месяца"1"– только первая неделя"1,3"– недели 1 и 3"2,3,4"– недели 2, 3 и 4
4. Параметр диапазона месяцев
Назначение: Фильтрует, какие месяцы года отображать.
Применяется к: Только недельным таймфреймам
Примеры формата:
""(пусто) – все месяцы года"1"– только январь"1,6,12"– январь, июнь, декабрь"3,4,5,9,10,11"– 1-й квартал (весна) и 4-й квартал (осень)
5. Параметр MaxDataRows
Назначение: Ограничивает количество строк (свечей), отображаемых в таблице.
Применяется к: Всем таймфреймам
Значение по умолчанию: 24
Формат:
-1или0– показать все доступные данные (без ограничений)- Любое положительное число – максимум столько строк
__________________________________________________________________________________________
ОСОБЕННОСТИ
Гибкость
- 8 групп колонок: переключение видимости Raw Data, Derived, Metrics, Eff Norm, Multipliers, Pressure, Key Observations, Key Metrics
- Множество таймфреймов: работает на субдневных (1м-1ч), многочасовых (2ч-12ч), дневных, недельных и месячных графиках
- Фильтрация: фильтр по времени (например, "8:00-16:00"), фильтр по неделям (например, "1,3"), фильтр по месяцам (например, "1,6,12")
- Максимум строк: ограничение отображения на последние N периодов или вокруг формирующейся свечи
- Цветовое выделение: опциональное градиентное выделение для любой группы колонок на основе выбранной метрики
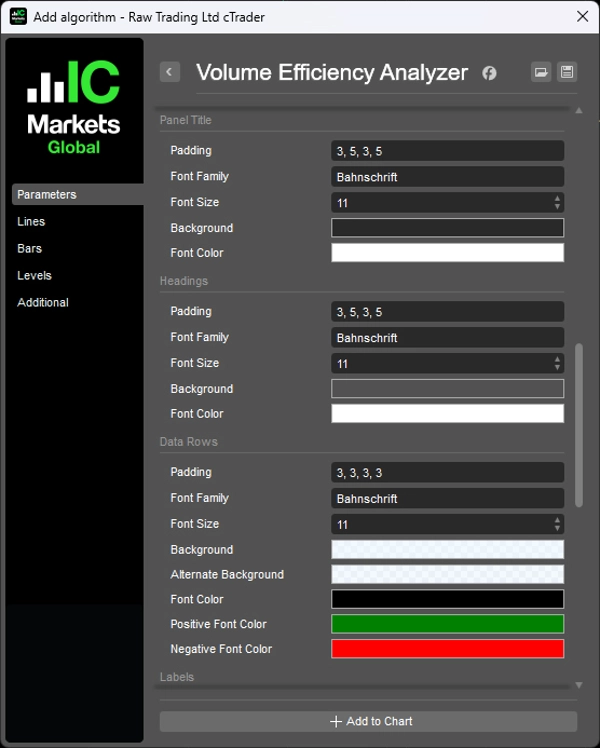
- Настраиваемый стиль: полный контроль над шрифтами, цветами, отступами, шириной колонок
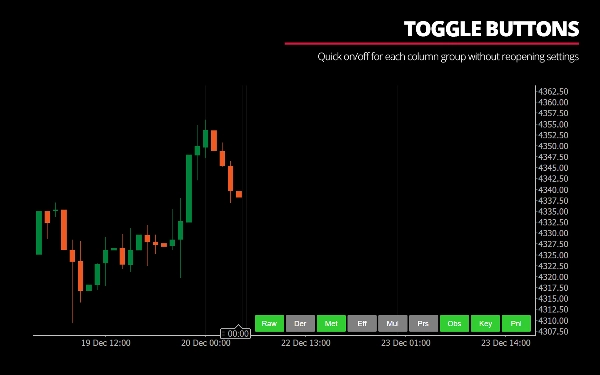
- Кнопки переключения: быстрое включение/выключение каждой группы колонок без повторного открытия настроек
Поддержка часовых поясов
- Корректирует время сервера брокера относительно вашего локального времени
- Настраиваемое время начала сессии (Сидней, Токио, Франкфурт, Лондон, Нью-Йорк)
- Почасовое начало торгового дня (например, 4:00 для трейдеров азиатской сессии)
Оптимизация производительности
- Бинарный поиск для эффективного поиска свечей
- Однопроходные вычисления min/max для выделения
- Ограничение обновлений в реальном времени до 500 мс для предотвращения задержек
- Подсказки поиска для избежания повторных запросов
__________________________________________________________________________________________
ПОНИМАНИЕ МЕТРИК
Что делает движение хорошим?
- Высокая эффективность: прошло далеко при небольшом объеме
- Низкий процент потерь: минимальные хвосты, чистые направленные тела
- Согласованное давление: доминирование покупательского давления при бычьих закрытиях (или наоборот)
- Сильная убежденность: высокая направленная приверженность
Что делает движение плохим?
- Низкая эффективность: требуется много объема, чтобы пройти немного
- Высокий процент потерь: большие хвосты, маленькие тела (флет)
- Противоречивое давление: бычье закрытие, но доминировало давление продавцов
- Слабая убежденность: отсутствие направленной приверженности несмотря на объем
Что означает поглощение?
Когда цена с трудом движется несмотря на высокий объем, рынок «поглощает» этот объем. Это указывает на:
- Высокое поглощение: присутствует сопротивление/поддержка, трудно сдвинуть цену
- Низкое поглощение: легкое движение, мало сопротивления
Примеры интерпретаций:
«Сильный бычий импульс (покупки доминируют)»
- Высокий объем + высокая эффективность + низкие потери + бычий чистый результат + доминирование покупательского давления
«Нерешительность при высоком объеме (возможный разворот)»
- Высокий объем + экстремальные потери + маленькое тело + сбалансированное давление
«Бычье закрытие несмотря на медвежье давление»
- Закрытие вверх, но давление продавцов превысило давление покупателей (дивергенция, потенциальная ловушка)
«Низкое участие, отсутствие приверженности»
- Низкий объем + средняя эффективность + отсутствие явного доминирования давления
__________________________________________________________________________________________
ПРЕИМУЩЕСТВА И ВЫГОДЫ
1. Квантифицирует интуицию
- Если вы когда-либо думали «это выглядит как флет» или «это движение кажется слабым», этот индикатор количественно оценивает эти наблюдения
- Предоставляет объективные метрики для субъективных оценок
2. Многомерный анализ
- Большинство инструментов показывают либо объем, либо ценовые паттерны. Этот показывает их взаимосвязь
- Объединяет объем, структуру цены, направленную предвзятость и динамику давления в одном виде
3. Контекстуальная осведомленность
- Оценка каждой свечи учитывает контекст тренда
- Различает «консолидацию в восходящем тренде» и «консолидацию в нисходящем тренде»
- Отмечает контртрендовые движения, которые могут быть ловушками
4. Образовательный
- Интерпретации на естественном языке помогают изучать динамику рынка
- Со временем вы начнете распознавать паттерны эффективности без индикатора
5. Универсальное применение
- Трейдеры тренда: определяют, когда тренды сильные или истощаются
- Трейдеры флетов: выявляют зоны консолидации с высоким уровнем потерь
- Трейдеры прорывов: обнаруживают решительные прорывы с высоким объемом и ложные прорывы
- Трейдеры объема: видят объем в контексте достигнутого
6. Без задержек
- Все вычисления основаны на завершенных свечах (или текущей формирующейся свече)
- Без сглаживания, без скользящих средних, без перерисовки
__________________________________________________________________________________________
ПРОБЛЕМЫ И ОПАСЕНИЯ
Перед использованием этого индикатора учтите важные моменты:
Этот индикатор НЕ для всех:
1. Высокая сложность
- Более 20 метрик в 8 группах колонок
- Требуется понимание анализа объема, ценового действия и микроструктуры рынка
- Крутая кривая обучения — ожидайте 1-2 недели наблюдений, прежде чем паттерны станут ясны
2. Перегрузка информацией
- Вид по умолчанию «показать все» может быть перегружающим
- Необходимо настроить под ваш торговый фокус
- Возможен паралич принятия решений при попытке использовать все метрики одновременно
3. Не торговая система
- Индикатор НЕ говорит, когда покупать или продавать
- Он показывает, что делает рынок, а не что ДОЛЖНЫ делать ВЫ
- Вы должны интегрировать его с собственными правилами входа/выхода
4. Требуется интерпретация
- «Нерешительность при высоком объеме» может означать предстоящий прорыв ИЛИ истощение
- «Эффективное бычье движение» не гарантирует продолжения
- Вам нужен контекст рынка, выходящий за рамки того, что показывает индикатор
5. Ограничения объема
- Форекс использует тиковый объем (количество сделок), а не реальный объем
- Инструменты с низкой ликвидностью могут показывать нестабильные показатели эффективности
- Новостные события могут создавать всплески объема, временно искажающие метрики
6. Производительность на низких таймфреймах
- На 1-минутных графиках с более чем 100 видимыми свечами интерфейс может работать медленно
- Больше свечей = больше вычислений при обновлении
- Рекомендуется использовать таймфреймы ≥5 минут для мониторинга в реальном времени
7. Нет оповещений
- В настоящее время не генерирует оповещения для конкретных условий
- Вы должны самостоятельно следить за отображением
8. Субъективные пороги
- «Высокий» объем определяется как 1.25x среднего — это мой личный порог
- «Экстремальные» потери — ≥80% — также субъективно
- Вы можете не соглашаться с этими определениями, но они зашиты в код
__________________________________________________________________________________________
КАК ЭТО РАБОТАЕТ
1. Сбор данных
- Определите период анализа (диапазон даты/времени)
- Для каждой свечи в периоде соберите данные OHLCV с графика
- Вычислите производные и показатели эффективности для каждой свечи
- Агрегируйте метрики для определения средних и экстремальных значений
2. Логика интерпретации
Оценки на естественном языке следуют матрице принятия решений с приоритетами:
Приоритет 1: паттерны нерешительности
- Экстремальный процент потерь (≥80%) или маленькое тело с большими хвостами → сигналы додзи/отторжения
- Высокий объем + экстремальные потери → потенциальное истощение
Приоритет 2: сценарии высокого объема
- Высокий объем + высокая эффективность + низкие потери → решительный импульс
- Высокий объем + высокая эффективность + высокие потери → прорыв с сопротивлением
- Высокий объем + низкая эффективность + высокие потери → поглощение/оспаривание движения
Приоритет 3: сигналы, основанные на эффективности
- Высокая эффективность независимо от объема → чистые/эффективные движения
- Низкая эффективность → дрейф, измельчение или слабые движения
Приоритет 4: запасные варианты по уровню объема
- Низкий объем → дрейф, отсутствие приверженности
- Средний объем → оценивается по убежденности, проценту тела, уровню потерь
3. Уточнения:
- Анализ давления выявляет противоречия (например, «бычье закрытие, но доминировало давление продавцов»)
- Анализ хвостов выявляет отторжение (верхние хвосты на бычьих свечах = продавцы защищали максимумы)
- Контекст тренда добавляет метки «[с трендом]» или «[против тренда]»
4. Итоговый расчет
- Подсчет бычьих и медвежьих свечей
- Вычисление направленной эффективности (бычьи движения против медвежьих)
- Измерение коэффициентов поглощения (насколько сильно сопротивлялась каждая сторона)
- Вычисление кумулятивного чистого движения и контекста тренда
- Генерация единого смещения, объединяющего количество, величину и направление тренда
__________________________________________________________________________________________
ТЕХНИЧЕСКИЕ ЗАМЕТКИ
Метод расчета
- Использует кумулятивный анализ свечей внутри каждого периода
- Суммирует объем, хвосты, тела всех подсвечей
- Вычисляет чистое направленное смещение на основе кумулятивных данных
- Более точен, чем простой анализ OHLC
Нормализация
- Эффективность нормализована относительно мин/макс в видимом наборе данных
- Обеспечивает контекстуально корректные оценки
- Шкала оценок: Экстремально (80-100%) → Высоко (60-80%) → Средне (40-60%) → Низко (20-40%) → Очень низко (0-20%)
Контекст тренда
- Вычисляет кумулятивные чистые пипсы за все предыдущие периоды
- Определяет последовательные направленные периоды
- Сравнивает недавнюю и предыдущую эффективность и давление
- Метки: «Восходящий тренд (сильный)», «Нисходящий тренд (слабый)», «Флет»
__________________________________________________________________________________________
ЗАКЛЮЧИТЕЛЬНОЕ ЗАМЕЧАНИЕ
Этот индикатор создан с убеждением, что понимание качества рынка важнее, чем предсказание направления.
Вместо вопроса «цена пойдет вверх?» он задает:
- «Это движение высокого качества?»
- «Покупатели/продавцы борются или действуют эффективно?»
- «Этот прорыв устойчив или слаб?»
- «Текущие динамики согласованы или расходятся?»
Фокусируясь на качестве вместо предсказания, трейдеры могут:
- Избегать сделок с низкой вероятностью
- Входить в движения с поддержкой
- Выходить, когда усилие превышает результат
- Понимать, когда лучше не входить (плохое качество рынка)
Если вы цените прозрачность, образование и понимание почему цена движется именно так, этот индикатор может быть для вас полезен.
Если вы предпочитаете простоту и быстрые сигналы, другие инструменты подойдут вам лучше.
__________________________________________________________________________________________
БОЛЬШЕ БЕСПЛАТНЫХ ИНДИКАТОРОВ
Изучите широкий спектр инструментов анализа рынка — от структуры и объема до регрессии, волатильности и пользовательских таймфреймов.
Исходный код доступен в репозитории GitHub repository.
Все бесплатно для использования. Но если хотите поддержать кофе, можете отправить поддержку здесь.
Поддержка/Сопротивление
Объем
- Volume Activity Profiler
- Volume Efficiency Analyzer
- Volume Profile Analytics
- Volume Profile - Updated
- Volume Spread Analysis
- VWAP (Volume Weighted Average Price)
Скользящие средние
- SSL Channel
- Anchored Moving Average
- Deviation-Scaled Moving Average
- Gann High Low Activator
- Instantaneous Trendline
- Kaufman Adaptive MA with Trend Vision
- Moving Average Channel
- Moving Averages Suite
- Trend Channel Moving Average
Утилиты/Пользовательские
Регрессионные
Волатильность
Осцилляторы
__________________________________________________________________________________________
ОТКАЗ ОТ ОТВЕТСТВЕННОСТИ
Торговля связана с риском. Этот индикатор предназначен только для технического анализа — всегда применяйте надлежащее управление рисками и торгуйте ответственно.
ОБРАТНАЯ СВЯЗЬ И УЛУЧШЕНИЯ
Если у вас есть предложения, запросы функций или идеи по улучшению, пожалуйста, оставьте комментарий во вкладке Обсуждение. Ваша обратная связь помогает улучшить индикатор для всех.
Сводка
Key features include customizable column groups, color highlighting, and time zone adjustments for various trading sessions. The indicator quantifies market conditions by identifying efficient versus inefficient moves, absorption levels, and directional pressure, helping traders distinguish between decisive, exhausted, or indecisive price actions after they occur. It incorporates trend context and natural language interpretations to aid understanding of market dynamics.
Volume Efficiency Analyzer does not generate buy/sell signals or alerts; it is intended to complement traders’ own strategies by providing objective metrics that quantify market quality rather than predict direction. It requires familiarity with volume analysis and market microstructure due to its complexity and information density. The indicator is suitable for trend, range, breakout, and volume-focused traders seeking a comprehensive, multi-dimensional view of market behavior.
Отзывы покупателей
5 | 100 % | |
4 | 0 % | |
3 | 0 % | |
2 | 0 % | |
1 | 0 % |
Обсуждение
Частые вопросы
Больше от этого автора
























Цена