

Beschreibung
MA-basierte Trendaktivierung mit Multi-Timeframe-Modi und Trendlinienprojektion.
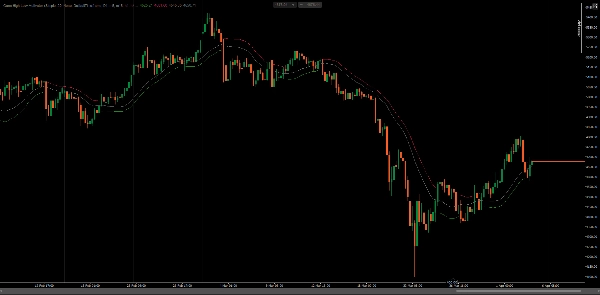
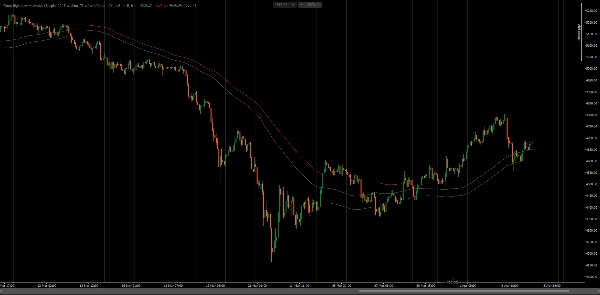
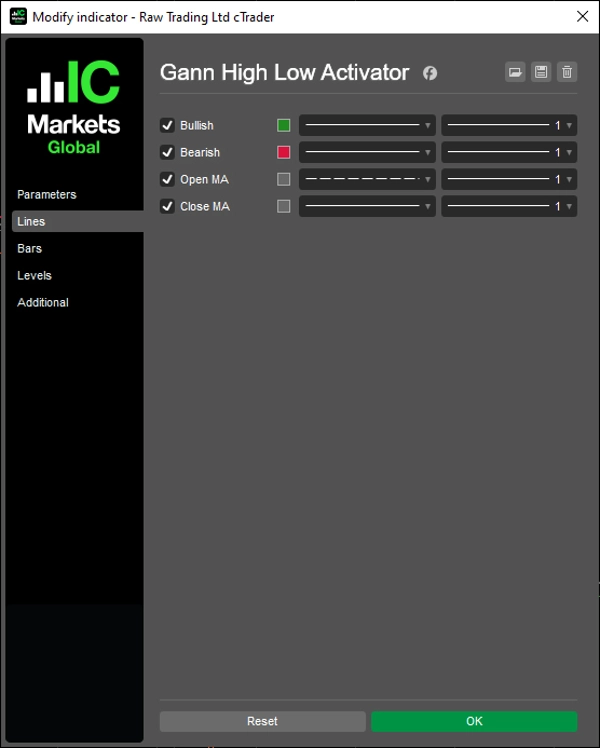
Verfolgt die Marktrichtung, indem der Schlusskurs mit gleitenden Durchschnitten von Hoch und Tief über einen konfigurierbaren Zeitraum verglichen wird. Wechselt den Zustand, wenn der Schlusskurs über MA(Hoch) in bullisch oder unter MA(Tief) in bärisch kreuzt – wobei das gegenüberliegende Band als aktives Unterstützungs- oder Widerstandsniveau dargestellt wird.
Vier Berechnungsmodi (Keine, Interpoliert, SkaliertPeriode, Trendlinie), Open- und Close-MA-Ausgaben, Zeitrahmenmusterauflösung für automatische HTF-Auswahl und Trendlinienprojektion zur Schätzung der nächsten Kerze bieten einen vollständigen Trendfolge-Rahmen für Trader, die über mehrere Zeitrahmen und Analysearten arbeiten.
EIGENSCHAFTEN
Kernaktivierungslogik
- Bullischer Zustand: ausgelöst, wenn der Schlusskurs über MA(Hoch) kreuzt – MA(Tief) wird als dynamische Unterstützung dargestellt
- Bärischer Zustand: ausgelöst, wenn der Schlusskurs unter MA(Tief) kreuzt – MA(Hoch) wird als dynamischer Widerstand dargestellt
- Open-MA- und Close-MA-Ausgaben für zusätzliche Konfluenz- und Overlay-Analyse
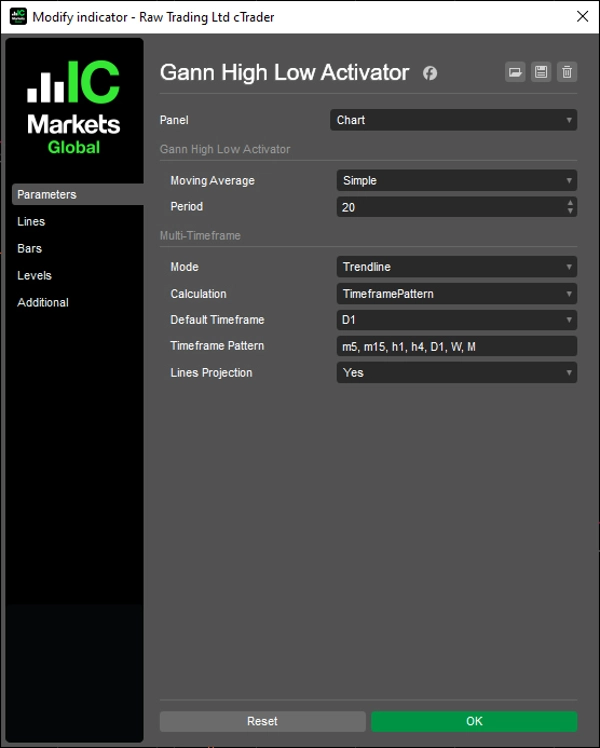
- Unterstützt alle cTrader gleitenden Durchschnittstypen (SMA, EMA, DEMA, TEMA, WMA usw.)
Multi-Timeframe-Modi
- Keine: Standardberechnung im Einzelzeitrahmen auf dem aktuellen Chart
- Interpoliert: glatte HTF-Werte, linear auf LTF-Kerzen abgebildet für kontinuierliches Overlay
- SkaliertPeriode: skaliert die Periode anhand des HTF-zu-LTF-Verhältnisses – keine zusätzlichen Datenreihen erforderlich
- Trendlinie: zeichnet Chart-Trendlinienobjekte zwischen HTF-Kerzenbegrenzungen mit voller Stilkontrolle
Zeitrahmenauflösung
- DefaultTimeframe: manuelle Auswahl eines beliebigen HTF aus dem Parameter-Dropdown
- TimeframePattern: automatische Auswahl des nächsthöheren Zeitrahmens aus einer kommagetrennten Tokenliste (z. B.
m5, m15, h1, h4, D1, W, M) - Pattern-Tokens unterstützen Minuten (m1–m45), Stunden (h1–h12), Tage (d1–d3), wöchentlich (W) und monatlich (M)
Trendlinienmodus Extras
- Unabhängige Farb-, Dicken- und Stilkontrolle pro Ausgabelinie
- Sichtbarkeitsschalter baut alle Segmente automatisch neu auf – keine veralteten Objekte
- Projektion-Segment verlängert das letzte HTF-Segment um eine Kerze nach vorne zur Antizipation
Volle Anpassung
- Konfigurierbarer MA-Typ und Periode
- Pro-Ausgabelinien-Stil, der von Trendlinienobjekten im Trendlinienmodus übernommen wird
- Sauberes Fallback zum aktuellen Zeitrahmen, wenn HTF ≤ Chart-Zeitrahmen
- Längensteuerung der Linien für Anzeigeumfangsverwaltung
- On-Chart UI-Panel zur Laufzeitanpassung der Parameter ohne Öffnen der Einstellungen
Linienlänge
- Steuert, wie weit zurück Linien angezeigt werden – von Stunde8 bis Jahr10
Gilt für alle Modi: Serienausgaben und Trendlinienobjekte
UI-Steuerungen
- On-Chart Kombobox-Panel für schnellen Zugriff auf MA-Typ, MTF-Modus, Berechnung, Zeitrahmen und Linienlänge
- Konfigurierbare Position: ObenLinks, ObenRechts, UntenLinks, UntenRechts oder versteckt (Keine)
__________________________________________________________________________________________
MEHR KOSTENLOSE INDIKATOREN
Entdecken Sie eine breite Palette von Marktanalysetools – von Struktur und Volumen bis hin zu Regression, Volatilität und benutzerdefinierten Zeitrahmen.
Der Quellcode ist auf GitHub Repository verfügbar.
Alle kostenlos nutzbar. Wenn Sie jedoch Kaffeeunterstützung senden möchten, können Sie dies hier tun.
Unterstützung/Widerstand
Volumen
- Volumenaktivitätsprofiler
- Volumeneffizienz-Analysator
- Volumenprofil-Analytik
- Volumenprofil - Aktualisiert
- Volumenspread-Analyse
- VWAP (Volumen-gewichteter Durchschnittspreis)
Gleitende Durchschnitte
- SSL-Kanal
- Verankerter gleitender Durchschnitt
- Abweichungsskaliertes gleitendes Mittel
- Gann High Low Aktivator
- Instantane Trendlinie
- Kaufman Adaptive MA mit Trend Vision
- Gleitender Durchschnittskanal
- Gleitende Durchschnitte Suite
- Trendkanal gleitender Durchschnitt
Dienstprogramme/Benutzerdefiniert
Regressionsbasiert
Volatilität
Oszillatoren
__________________________________________________________________________________________
HAFTUNGSAUSSCHLUSS
Der Handel birgt Risiken. Dieser Indikator ist nur für die technische Analyse gedacht – wenden Sie stets ein angemessenes Risikomanagement an und handeln Sie verantwortungsbewusst.
FEEDBACK & VERBESSERUNGEN
Wenn Sie Vorschläge, Funktionswünsche oder Ideen zur Verbesserung haben, hinterlassen Sie bitte einen Kommentar im Diskussions-Tab. Ihr Feedback hilft, den Indikator für alle zu verbessern.
Zusammenfassung
Key features include four multi-timeframe calculation modes—None (single timeframe), Interpolated (smoothed higher timeframe values), ScaledPeriod (period scaled by timeframe ratio), and Trendline (trendline objects between higher timeframe bars with style control). It supports all cTrader MA types (SMA, EMA, DEMA, TEMA, WMA, etc.) and offers Open and Close MA outputs for additional analysis.
Timeframe resolution options allow manual or automatic selection of higher timeframes based on customizable token patterns. Trendline mode provides independent styling and projects the trendline forward by one bar for anticipation. The indicator includes extensive customization for MA type, period, line styles, display length, and an on-chart UI panel for runtime parameter adjustments. It is suitable for traders applying trend-following techniques across multiple symbols and timeframes.
Diskussion
Kundenbewertungen
Häufig gestellte Fragen (FAQ)
Mehr von diesem Autor






Preis