
Açıklama
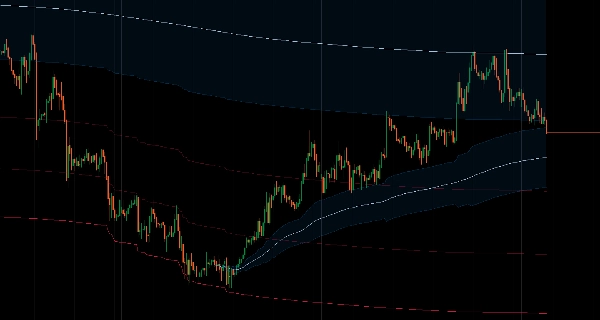
Hareketli ortalama hesaplamasını herhangi bir piyasa anına kilitleyin ve fiyat davranışını ileriye doğru uzadıkça takip edin.
Hesaplamayı seçtiğiniz başlangıç noktasına (manuel tarih-saat veya 1 saat ile 10 yıl arasında geri dönüş dönemi) sabitler, ardından gerçek fiyat aralığına dayalı uyarlanabilir Fibonacci bantlarıyla doğal olarak büyür.
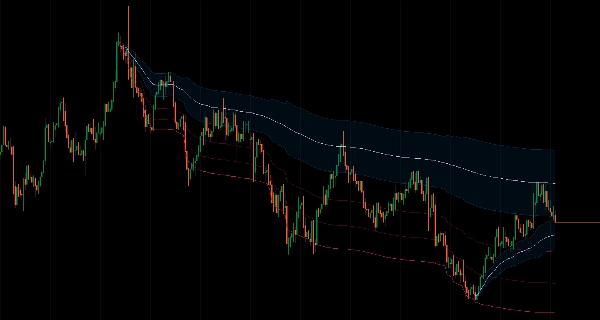
Gerçek fiyat hareketine uyum sağlayan sekiz Fibonacci seviyesi (%11,4 ile %100 arası), yerleşik %38,2-%62,8 ortalama dönüş bölgesi, çift MA türleri (SMA/EMA), çoklu görüntüleme modları (tam bantlar, sadece aşırı sınırlar, sadece dönüş bölgesi) ve uzun zaman dilimleri için maksimum dönem sınırlayıcı, önemli salınım noktalarından geri çekilmeleri hedefleyen ve olay sonrası fiyat davranışı analizini yapan tüccarlar için olay tabanlı momentum takibi sağlar.
ÖZELLİKLER
Zamana Bağlı Hesaplama
- Sabit dönemler kullanan standart MA'ların aksine, seçtiğiniz başlangıç noktasından doğal olarak büyür
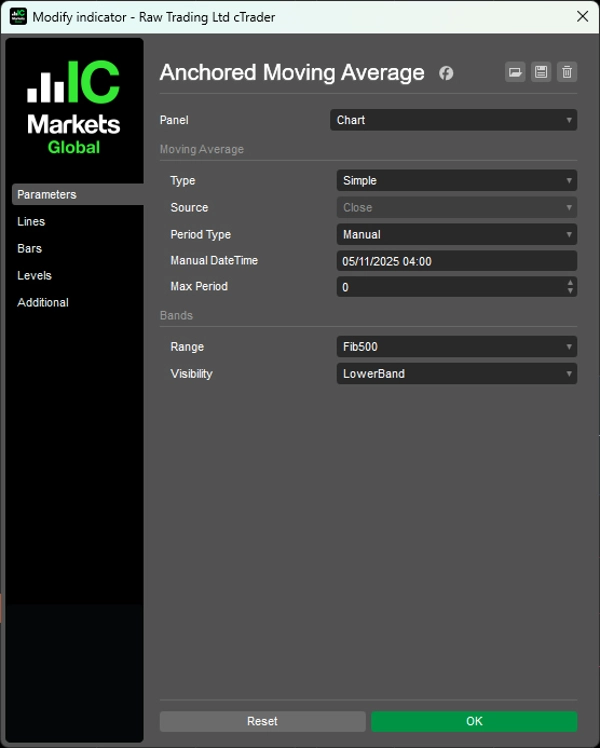
- Esnek sabitleme: Manuel tarih-saat ayarlayın veya önceden tanımlı geri dönüş dönemlerini kullanın (1 saat ile 10 yıl arası)
- Önemli piyasa anlarından momentum takibi
- Farklı zaman dilimlerinde tutarlı sabitleme noktaları
Uyarlanabilir Fibonacci Bantları
- Rastgele ATR katları yerine gerçek fiyat aralığına dayalı otomatik hesaplanan bantlar
- Gerçek fiyat hareketine uyum sağlayan 8 Fibonacci seviyesi (%11,4 ile %100 arası)
- Ortalama dönüş bölgeleri: Yüksek olasılıklı giriş alanları için yerleşik %38,2-%62,8 dönüş bölgesi
- Matematiksel olarak tanımlanmış olasılık bölgeleri
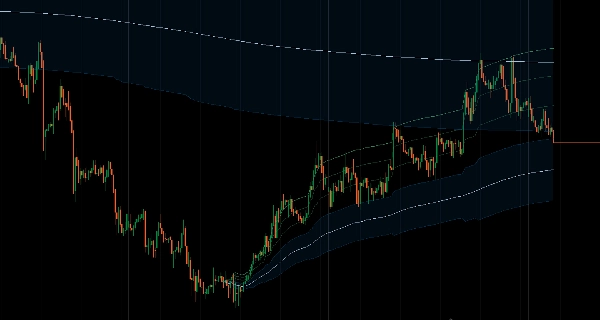
İki MA Türü
- Basit Hareketli Ortalama
- Üssel Hareketli Ortalama
- Maksimum dönem sınırlayıcı: Uzun zaman dilimlerinde aşırı yumuşatmayı önler
Çoklu Görüntüleme Modları
- Tam bantlar: Tüm Fibonacci seviyeleri görünür
- Sadece üst/alt: Aşırı sınırları gösterir
- Sadece dönüş bölgesi: Ortalama dönüş alanına odaklanır
- Dağınıklık olmayan, amaçlı ve temiz tasarım
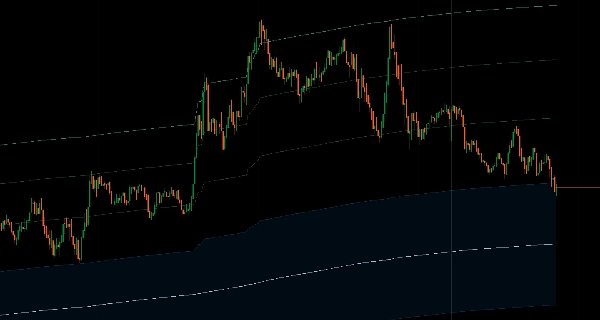
Olay Tabanlı Analiz
- Mevcut fiyatın önemli seviyelerden hareketle ilişkisini görün
- Olay sonrası fiyat davranışını takip edin
- Net referans noktaları ile yapı tabanlı girişler
__________________________________________________________________________________________
DAHA FAZLA ÜCRETSİZ GÖSTERGE
Yapı ve hacimden regresyon, volatilite ve özel zaman dilimlerine kadar geniş bir piyasa analiz aracı yelpazesini keşfedin.
Kaynak kodu GitHub deposunda mevcuttur.
Tamamen ücretsizdir. Ancak kahve desteği göndermek isterseniz, bunu buradan yapabilirsiniz.
Destek/Direnç
Hacim
- Hacim Aktivite Profili
- Hacim Verimlilik Analizörü
- Hacim Profili Analitiği
- Hacim Profili - Güncellenmiş
- Hacim Yayılım Analizi
- VWAP (Hacim Ağırlıklı Ortalama Fiyat)
Hareketli Ortalamalar
- SSL Kanalı
- Sabitlenmiş Hareketli Ortalama
- Sapma Ölçekli Hareketli Ortalama
- Gann Yüksek Düşük Aktivatörü
- Anlık Trend Çizgisi
- Trend Vizyonlu Kaufman Uyarlanabilir MA
- Hareketli Ortalama Kanalı
- Hareketli Ortalamalar Paketi
- Trend Kanalı Hareketli Ortalaması
Araçlar/Özel
Regresyon Tabanlı
Volatilite
Osilatörler
__________________________________________________________________________________________
FERAGATNAME
Ticaret risk içerir. Bu gösterge yalnızca teknik analiz içindir — her zaman uygun risk yönetimini uygulayın ve sorumlu şekilde işlem yapın.
GERİ BİLDİRİM & GELİŞTİRMELER
Önerileriniz, özellik talepleriniz veya geliştirme fikirleriniz varsa, lütfen Tartışma sekmesinde bir yorum bırakın. Geri bildiriminiz göstergenin herkes için iyileştirilmesine yardımcı olur.
Özet
The indicator features adaptive Fibonacci bands calculated based on the actual price range, not arbitrary multiples. It includes eight Fibonacci levels from 11.4% to 100%, with a built-in mean reversion zone between 38.2% and 62.8%, providing mathematically defined probability zones for potential entry areas. Multiple display modes are available, including full bands, extreme boundaries only, or reversion zone only, designed for a clean and purposeful chart presentation.
This tool facilitates analysis of price behavior relative to significant swing points or events, supporting structured entries and post-event price tracking. It is intended for technical analysis and includes a disclaimer advising responsible trading with proper risk management.
Müşteri değerlendirmeleri
5 | 100 % | |
4 | 0 % | |
3 | 0 % | |
2 | 0 % | |
1 | 0 % |


