
Mô tả
Chỉ báo Pinescriptlabs Store: Pinescriptlabs Store cBots : (cBot) Gold & BTC BreakoutSession Pivots(mới)
Hỗ Trợ &
Kháng Cự SmartTrend
Đường
Phân Tích
Cấu Trúc Thị Trường
Động
của
Điểm
Quay Đầu
Hồi Quy
Tuyến Tính
Fibonacci
Đa Khung Thời Gian
Gap Giá Trị Công Bằng Động Lực
Theo Dõi
Thiên Hướng Nến
Đa Cấp
Tự Động
Hỗ Trợ và
Kháng Cự
Xu Hướng
Đường
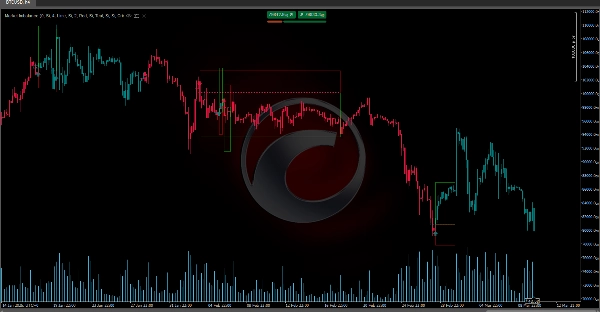
MarketImbalanceDetector xác định sự mất cân bằng thị trường và đánh dấu trực quan các khu vực chính dựa trên các mẫu giá và biến động (ATR). Dưới đây là tóm tắt đơn giản về cách nó hoạt động:
🔍 Phát Hiện Tín Hiệu
Nó so sánh giá của các thanh trước để phát hiện các mẫu tăng hoặc giảm. Sử dụng các điều kiện cụ thể (như so sánh đáy và đỉnh của các thanh trước) và lọc tín hiệu với biến động hiện tại, nó đảm bảo rằng chuyển động là đáng kể.
📊 Hiển Thị Mất Cân Bằng
Khi một tín hiệu được xác định, chỉ báo sẽ vẽ trên biểu đồ:
- Một Khu Vực Mất Cân Bằng (một hình chữ nhật) đánh dấu vùng nơi mẫu xuất hiện.
- Một Đường Mức Trung Bình (tính toán từ các đỉnh và đáy liên quan) để giúp hình dung hỗ trợ hoặc kháng cự.
- Một Biểu Tượng (một mũi tên) chỉ hướng tín hiệu (⬆️ cho tăng, ⬇️ cho giảm).
Khu Vực OP/PE
Ngoài ra, nó tạo ra các khu vực gọi là OP () và PE (Điểm Thoát). Các khu vực này được tính bằng cách cộng hoặc trừ một bội số của ATR vào mức trung bình, giúp xác định các khu vực để chốt lời hoặc cắt lỗ.
Tóm tắt
When a signal is detected, the indicator visually marks the chart with:
- An Imbalance Area (a rectangle) highlighting the zone where the pattern occurred.
- An Average Level Line calculated from relevant highs and lows to indicate potential support or resistance.
- An Icon (arrow) showing the signal direction: upward for bullish and downward for bearish.
Additionally, the indicator calculates OP (Order Point) and PE (Escape Point) zones by adding or subtracting multiples of ATR to the average level. These zones assist traders in defining areas for taking profit or cutting losses.
This tool supports analysis across various markets including cryptocurrencies (e.g., BTCUSD), commodities (e.g., XAUUSD), and integrates concepts related to breakout strategies, trend indicators like Supertrend, and momentum measures such as RSI. It is intended to enhance market structure understanding and assist in decision-making by visually representing key imbalance zones on trading charts.


