Mô tả
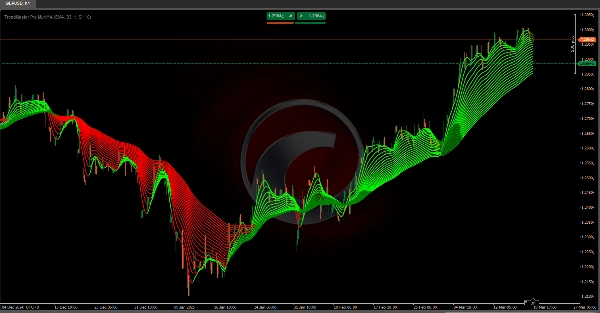
📈 Trend Master Pro MultiMA – Công Cụ Phát Hiện Xu Hướng Tối Ưu 🚀
Chỉ báo này vẽ 20 đường trung bình động với các chu kỳ khác nhau (5, 10, 15, 20, 25, 30, 35, 40, 45, 50, 55, 60, 65, 70, 75, 80, 85, 90, 95, và 100). Với mỗi đường:
1️⃣ 📊 Chọn Loại Tính Toán Của Bạn: Lựa chọn giữa SMA, EMA, RMA, WMA, hoặc VWMA theo sở thích của bạn. Ngoài ra, bạn có thể bật làm mượt hồi quy tuyến tính để giảm nhiễu và có xu hướng rõ ràng hơn.
2️⃣ 📏 Định Nghĩa Kênh Tham Chiếu: Một kênh dựa trên phạm vi giá được tính toán sử dụng 200 cây nến cuối cùng. Chiều rộng kênh có thể điều chỉnh được, mở rộng khi biến động giá cao và thu hẹp khi thị trường ổn định hơn.
3️⃣ 📈 So Sánh Đường Trung Bình Động với Kênh: Mỗi đường trung bình động được phân tích liên quan đến chiều cao của kênh và đỉnh & đáy của nó trong một khoảng thời gian xác định (mặc định: 20 cây nến).
- 📊 Nếu sự khác biệt giữa giá trị cao nhất và thấp nhất của đường trung bình động vượt quá chiều rộng kênh, đó là tín hiệu của xu hướng mạnh mẽ (tăng hoặc giảm).
- ⚖️ Nếu sự khác biệt nằm trong hoặc gần kênh, thị trường được coi là trung tính hoặc đi ngang.
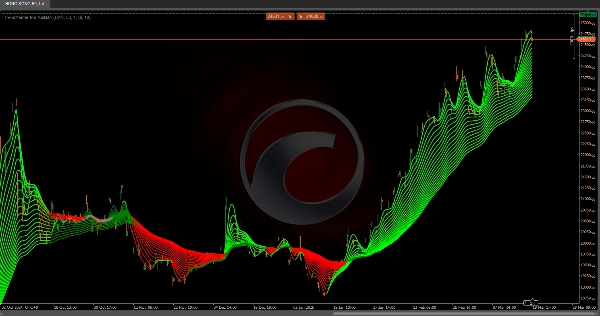
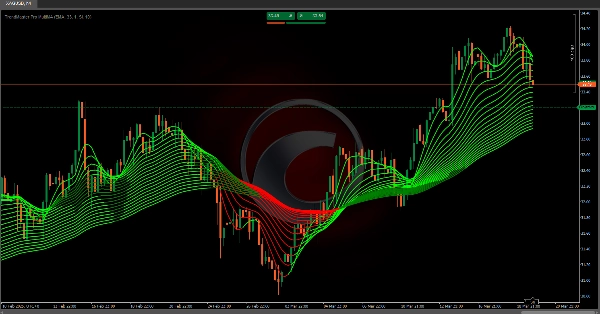
4️⃣ 🎨 Hệ Thống Tô Màu Dựa Trên Xu Hướng: Mỗi đoạn của các đường trung bình động được tô màu theo sức mạnh và hướng xu hướng:
- 🟢 Màu Xanh Lá = Phát hiện xu hướng tăng
- 🔴 Màu Đỏ = Phát hiện xu hướng giảm
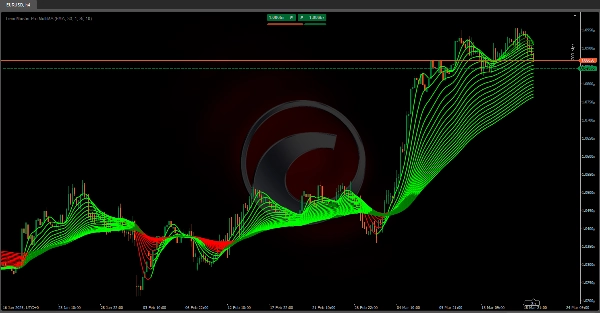
5️⃣ 📉 Hiển Thị Xu Hướng: Chỉ báo kết nối mỗi giá trị đường trung bình động từ cây nến này sang cây nến khác, tạo thành một cấu trúc quạt của các đường xu hướng. Mỗi đường trung bình động tự động điều chỉnh màu sắc dựa trên xu hướng đã tính toán.
✅ Tại Sao Nên Dùng Trend Master Pro MultiMA?
Phương pháp thích ứng đa khung thời gian—kết hợp nhiều đường trung bình động, kênh giá và làm mượt hồi quy—giúp nhanh chóng nhận diện các pha thị trường:
🔹 Xu hướng tăng ✅
🔹 Xu hướng giảm ❌
🔹 Di chuyển ngang/đi ngang 🔄
🚀 Hoàn hảo cho các nhà giao dịch tìm kiếm cái nhìn trực quan rõ ràng để đưa ra quyết định tốt hơn trong khung thời gian ngắn, trung và dài hạn! 📊🔥
Các chỉ báo Ctrader Store:
Dynamic Market Structure
Analysis of Turning Points
Fibonacci Linear
Regression Multi-timeframe
Multi-Level Candle Bias
Tracker
Auto Support and
Resistance Trend Lines
Tóm tắt
Each moving average is compared against this channel and its own highs and lows over a defined period (default 20 candles). If the range of a moving average exceeds the channel width, it signals a strong bullish or bearish trend; if within or near the channel, the market is considered neutral or ranging. The indicator visually represents trends by connecting moving average values candle-to-candle, forming a fan-like structure of trendlines. Trend strength and direction are indicated by color coding: green for bullish and red for bearish trends.
This multi-timeframe adaptive tool integrates multiple moving averages, price channels, and regression smoothing to help traders quickly identify market phases—bullish, bearish, or ranging—across short, medium, and long-term timeframes.
Đánh giá của khách hàng
5 | 100 % | |
4 | 0 % | |
3 | 0 % | |
2 | 0 % | |
1 | 0 % |