
说明
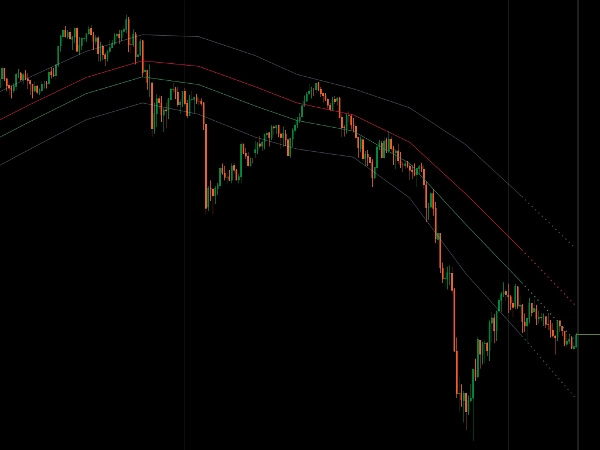
使用所有四个OHLC价格的移动平均线的动态价格通道,用于完整的市场结构分析。
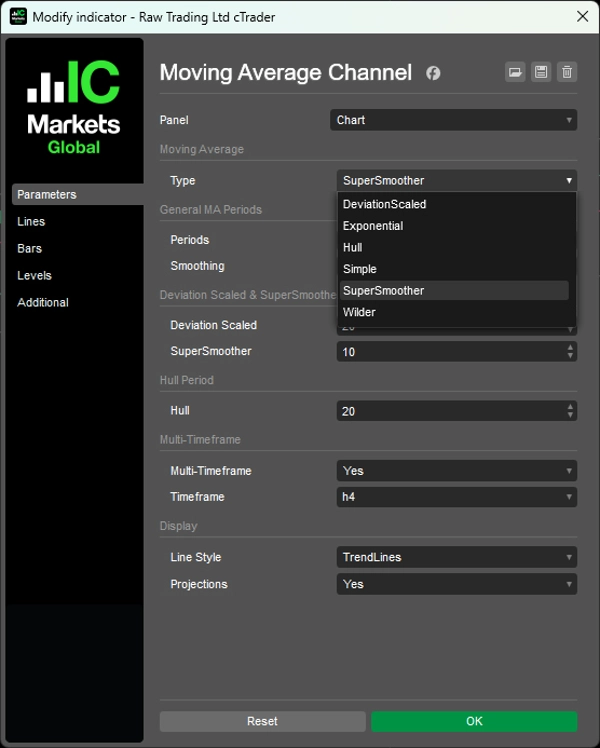
将您选择的MA类型(简单、指数、Wilder、偏差缩放、超级平滑、Hull)应用于高/低边界、开盘/收盘方向偏差和中位均衡线,以实现连贯的通道可视化。
内置斐波那契回归区(38.2%、61.8%),SMA/EMA的双重平滑层,创建超干净的通道,多时间框架显示,传统阶梯或对角趋势线模式,基于动量的智能预测,以及边界拒绝检测,为交易者提供全面的通道结构,目标是跨时间框架的均值回归和趋势强度评估。
功能特点
完整的价格结构
- 高/低定义通道边界
- 开盘/收盘显示方向偏差
- 中位线:高/低之间的50%水平——市场平衡的真正中心
- 四个价格协同工作,展示完整的市场图景
内置回归区
- 斐波那契38.2%和61.8%水平标记统计上显著的回撤区域
- 随价格变动自适应的动态区域
- 清晰的进出场参考点
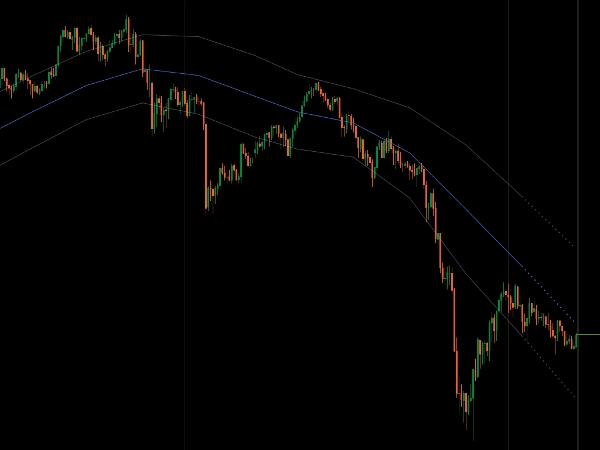
6种移动平均类型
- 简单、指数、Wilder、偏差缩放、超级平滑、Hull
- SMA/EMA的双重平滑:周期+额外平滑层,打造超干净通道
- 高级算法:偏差缩放适应波动性,超级平滑消除滞后,Hull强调近期价格动作
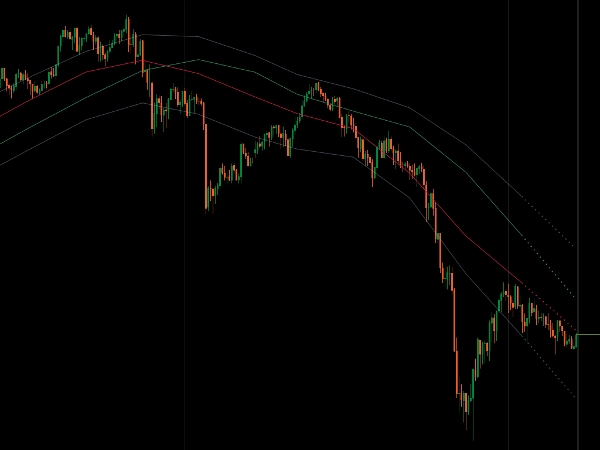
多时间框架与趋势线
- 在较低时间框架图表上查看较高时间框架通道
- 两种显示模式:传统阶梯线或对角趋势线(仅限MTF)
- 线条连接MTF柱收盘价,形成干净的对角结构
- 智能预测显示基于当前动量通道的走向
清晰的视觉系统
- 通道斜率显示动量
- 价格位置显示趋势强度
- 边界拒绝信号潜在反转
- 一个指标完成市场结构分析
__________________________________________________________________________________________
更多免费指标
探索各种市场分析工具——从结构和成交量到回归、波动率和自定义时间框架。
源代码可在GitHub 仓库获取。
全部免费使用。但如果您想支持作者喝咖啡,可以通过 这里捐助。
支撑/阻力
成交量
移动平均线
工具/自定义
基于回归
波动率
振荡器
__________________________________________________________________________________________
免责声明
交易涉及风险。此指标仅用于技术分析——请始终应用适当的风险管理并负责任地交易。
反馈与改进
如果您有建议、功能请求或改进想法,请在讨论标签页留言。您的反馈有助于为所有人改进该指标。
摘要
The indicator incorporates built-in Fibonacci reversion zones at 38.2% and 61.8%, which dynamically adjust with price movement to highlight significant pullback areas and provide clear entry and exit reference points. It supports multi-timeframe analysis, allowing higher timeframe channels to be displayed on lower timeframe charts, with two visualization modes: traditional stairstep lines or diagonal trendlines connecting multi-timeframe bar closes. Smart momentum-based projections indicate potential channel direction, while boundary rejection detection signals possible reversals.
This tool offers a cohesive visual system where channel slope reflects momentum and price position indicates trend strength, enabling traders to assess trend direction, momentum shifts, and mean reversion zones across various markets including Forex, Indices, Commodities, Crypto, and Stocks.


!["High-Low Divergence [Iridio Capital]" 标识](https://cdn.ctrader.com/image/webp/443c4661-7abb-40f1-842f-4b6ec560649b_40914)


