
Descrizione
VERSIONE AGGIORNATA DISPONIBILE QUI
Cerchi qualcosa di più delle semplici sovrapposizioni di timeframe nativi? L'indicatore Custom Timeframes estende questo concetto con potenti aggiunte:
- Periodi non standard (5H, 7H, 9H-23H, 25m, 35m, 50m, 55m, 4 giorni, 2 settimane, 3 settimane, multi-mensili, multi-annuali)
- Linee OHLC con controllo dello spostamento della barra per barre completate o in formazione
- Sette livelli di Fibonacci (11,4% a 88,6%) con evidenziazione della zona di equilibrio
- Medie mobili calcolate direttamente sulla struttura del timeframe personalizzato (9 tipi di MA, 8 fonti di prezzo)
- Pulsanti di attivazione per una gestione rapida delle funzionalità.
Se hai bisogno di periodi tra gli intervalli standard del grafico con sovrapposizione completa di analisi tecnica, dai un'occhiata alla versione aggiornata.
__________________________________________________________________________________________
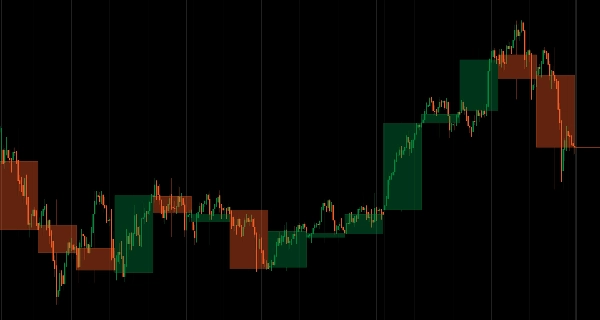
Sovrapponi candele HTF in tempo reale su qualsiasi grafico senza cambiare timeframe.
Mostra la struttura delle candele di timeframe superiore (corpo e stoppini) direttamente sui grafici di timeframe inferiore con aggiornamenti in tempo reale durante il progresso del periodo.
Selezione flessibile del timeframe (Daily su H1, Weekly su H4, Monthly su Daily), bias rialzista/ribassista codificato a colori (verde/rosso), stile linea e trasparenza personalizzabili, e prestazioni leggere offrono un contesto HTF continuo per i trader che monitorano la struttura su più timeframe senza cambiare grafico.
CARATTERISTICHE
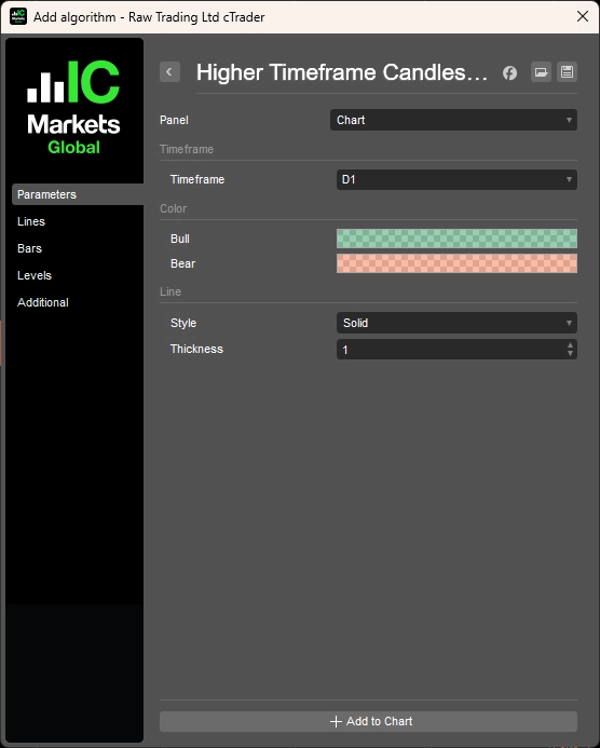
Selezione flessibile del timeframe
- Qualsiasi HTF: Daily su H1, Weekly su H4, Monthly su Daily—a tua scelta
- Aggiornamenti in tempo reale: la candela HTF si ridisegna durante il progresso del periodo
- Sempre in vista: fai trading su timeframe inferiori mantenendo il contesto del timeframe superiore
Chiarezza visiva
- Codificato a colori: Bull (verde), Bear (rosso)—conferma immediata del bias
- Personalizzabile: stile linea, spessore, trasparenza
- Presentazione pulita: corpo e stoppini chiaramente visualizzati
Integrazione semplice
- Nessun cambio di timeframe richiesto
- Mantiene il contesto del grafico mostrando la struttura HTF
- Leggero e ottimizzato per le prestazioni
__________________________________________________________________________________________
ALTRI INDICATORI GRATUITI
Esplora un'ampia gamma di strumenti di analisi di mercato—dalla struttura e volume alla regressione, volatilità e timeframe personalizzati.
Il codice sorgente è disponibile nel repository GitHub.
Tutti gratuiti da usare. Ma se vuoi offrire un supporto "caffè", puoi farlo qui.
Supporto/Resistenza
Volume
- Volume Activity Profiler
- Volume Efficiency Analyzer
- Volume Profile Analytics
- Volume Profile - Aggiornato
- Volume Spread Analysis
- VWAP (Prezzo Medio Ponderato per il Volume)
Medie Mobili
- Media Mobile Ancorata
- Media Mobile Scalata per Deviazione
- Linea di Tendenza Istantanea
- MA Adattiva di Kaufman con Visione di Tendenza
- Canale Media Mobile
- Suite di Medie Mobili
- Media Mobile Canale di Tendenza
Utility/Personalizzati
Basati su Regressione
Volatilità
Oscillatori
__________________________________________________________________________________________
DICHIARAZIONE DI ESCLUSIONE DI RESPONSABILITÀ
Il trading comporta rischi. Questo indicatore è destinato esclusivamente all'analisi tecnica — applica sempre una corretta gestione del rischio e fai trading responsabilmente.
FEEDBACK E MIGLIORAMENTI
Se hai suggerimenti, richieste di funzionalità o idee per miglioramenti, lascia un commento nella scheda Discussione. Il tuo feedback aiuta a migliorare l'indicatore per tutti.


