
说明
Pinescriptlabs 商店指标: 🤖Pinescriptlabs 商店 cBots:
SmartTrend 支撑 &
阻力线 黄金 & BTC 突破交易时段枢轴点(新)YieldShield" 🛡️
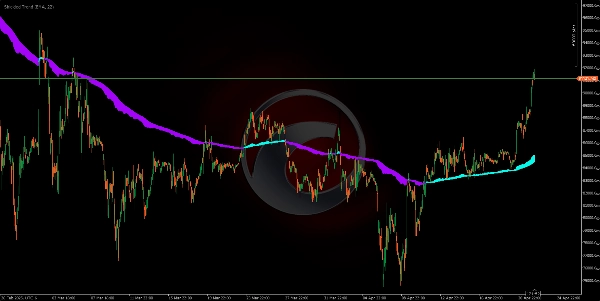
该 ShieldedTrend 指标基于两种广泛使用的交易方法的智能组合: Heikin-Ashi 蜡烛图 📊 和 指数移动平均线 (EMA) 📈。以下是逐步逻辑:
1️⃣ 基础:修改版 Heikin-Ashi 蜡烛图
Heikin-Ashi 蜡烛图是传统蜡烛图的平滑版本,旨在过滤市场噪音。其原始计算使用价格平均值,但 ShieldedTrend 在两个关键方面对其进行了修改:
- Heikin-Ashi 收盘价:
计算为真实蜡烛图四个主要价格的平均值:
(开盘 + 最高 + 最低 + 收盘) / 4 🔄。 - Heikin-Ashi 开盘价:
不是直接取自真实价格,而是前一个 Heikin-Ashi 蜡烛图的开盘价和收盘价的平均值。
这创造了一个 自然的“平滑”效果,去除了剧烈波动,使趋势更加清晰。
2️⃣ 使用 EMA 进行平滑处理
ShieldedTrend 对 Heikin-Ashi 蜡烛图的两个组成部分应用了 指数移动平均线 (EMA):
- 平滑开盘线:
应用于 Heikin-Ashi 开盘价的 EMA。 - 平滑收盘线:
应用于 Heikin-Ashi 收盘价的 EMA。
EMA 对最近数据赋予更大权重,使指标能够 快速响应趋势变化,同时保持平滑。
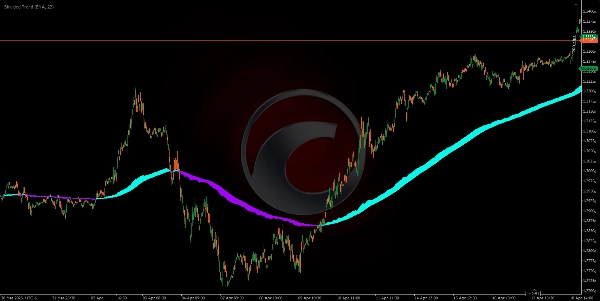
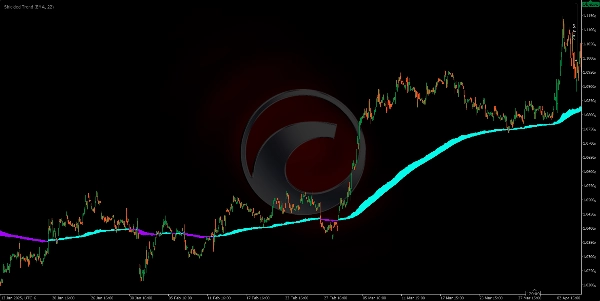
3️⃣ “保护区”(盾牌)🛡️
两条线(平滑开盘线和平滑收盘线)之间的彩色区域充当了一个 缓冲或确认区:
- 区域宽度:
取决于两条线之间的差距。 -
- 宽区域 = 强趋势(线条相距较远)💪。
- 窄区域 = 犹豫或弱趋势 🤔。
4️⃣ 综合交易逻辑
- 趋势信号:
颜色变化表示潜在反转(例如,青色变为紫色 = 可能开始下跌趋势)🔵🟣。 - 趋势强度:
彩色区域的宽度充当了一个 信心过滤器: -
- 仅当区域足够宽时交易 (避免震荡市场) ✅。
- 防止错误走势:
如果区域突然变窄,表明当前趋势可能正在失去动力——即使颜色尚未变化 ⚠。
🌟 为什么它有效?
- Heikin-Ashi + EMA:价格经过两次平滑处理(蜡烛图 + 移动平均线),过滤掉了 90% 的噪音 🎯。
- 保护区:避免在不明确的市场中交易,减少失败交易 📉➡️📈。
- 视觉方法:颜色和区域的结合使得即使是 初学者交易者 也能快速识别模式 ⚡。
摘要
AI 摘要
ShieldedTrend is a technical indicator that combines modified Heikin-Ashi candles with exponential moving averages (EMA) to provide smoothed trend signals and strength assessment. It modifies traditional Heikin-Ashi calculations by averaging the four main prices (open, high, low, close) for the close value and using the average of the previous Heikin-Ashi candle’s open and close for the open value. This creates a natural smoothing effect that reduces market noise and clarifies trend direction.
The indicator applies EMA smoothing to both the Heikin-Ashi open and close lines, enabling quick reaction to trend changes while maintaining smoothness. The area between these two smoothed lines forms a "Protection Zone" or shield, which acts as a buffer and confirmation zone. The width of this zone indicates trend strength: a wide zone signals a strong trend, while a narrow zone suggests indecision or a weak trend.
ShieldedTrend’s integrated trading logic uses color changes to signal potential trend reversals and the zone width as a confidence filter to avoid trading in choppy markets. The indicator helps protect against false moves by signaling when trend momentum is weakening even before a color change occurs. Its visual design facilitates quick pattern recognition, making it accessible for traders of all experience levels.
指标配置
客户评价
0.0
评价:0
客户评价
该产品尚无评价。已经试过了?抢先告诉其他人!
讨论
常见问答
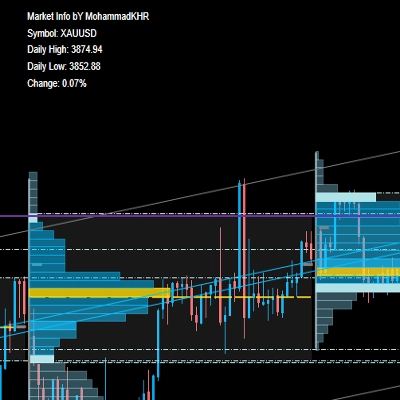
BTCUSD
Signal
Breakout
Supertrend
Commodities
RSI
Crypto
XAUUSD
cTrader Store 提供的所有产品,包括交易机器人、指标和插件,均由第三方开发者提供,仅供信息参考和技术访问之用。cTrader Store 并非经纪商,不提供投资建议、个人推荐或任何未来业绩保证。


价格
注册日期 03/10/2024
163
销售
39.16K
免费安装