
الوصف
🚀 أكثر من 10,000 متداول يستخدمون بالفعل أفضل المؤشرات🏆
👉 احصل على جميع أنظمتنا الأفضل هنا:
_______________________________________________
📌 مؤشرات هيكل السوق
· ✅ هيكل السوق المتقدم: Bos, Choch, SwinLevels, كتل الأوامر، هيكل السوقوآداة العثور على السيولة
· 🔄تحليل هيكل السوق الديناميكي لنقاط التحول
· 🧱 كتلة الأوامر
· ⚖️ اختلال السوق
· ⛓️ BOS & CHOCH
· 🧠 قوة ICT 3
_______________________________________________
🔚 أنظمة الخروج الذكية
_______________________________________________
📐 مؤشرات ZigZag
· ➖ ZigZag
_______________________________________________
🧱 مؤشرات الدعم والمقاومة
· 🟩 خطوط دعم ومقاومة SmartTrend
· 🧱 جميع مستويات الدعم والمقاومة
_______________________________________________
📊 مؤشرات الاتجاه والقناة
· 📊 سوبرتريند
· ⭐ قناة SSL المميزة
_______________________________________________
💧 أدوات الحجم والسيولة
· 📉 خريطة تصفية الرافعة المالية
_______________________________________________
⚡ مؤشرات الزخم و RSI
· 📈 مُشغل اتجاه RSI
· 🔎 تتبع تحيز الشمعة متعددة المستويات
Tracker
_______________________________________________
🔮 أدوات التنبؤ والإسقاط
· 📐 التنبؤ بناءً على Linreg& ATR
· 📏 انحدار فيبوناتشي الخطي متعدد الأطر الزمنية
· 📈 عارض تدفق السوق المدعوم بالحجم
📊 نظام انحدار اختراق الضغط -🚀
🎯 ما هو ولماذا يستخدم؟ ❓
يجمع هذا المؤشر بين نظامين مكملين لتحديد فرص تداول عالية الاحتمالية:
- نظام الضغط (ضغط التقلب): 🔍 يكتشف اللحظات التي يكون فيها السوق "مضغوطًا" وعلى وشك الانفجار في أي اتجاه 💥
- نظام قناة الاتجاه (الانحدار الخطي): 📈 يعرض الاتجاه السائد وحدود الدعم/المقاومة الديناميكية الخاصة به
🔍 كيف يعمل؟ ⚙️
الجزء 1: اكتشاف الضغط
يقوم المؤشر بتحليل إطار زمني أعلى (افتراضي: يومي) ويبحث عن الشموع التي يكون نطاقها (الفرق بين الأعلى والأدنى) هو الأصغر في:
• 7 فترات = "ضغط قصير" (ضغط قصير)
• 10 فترات = "ضغط ممتد" (ضغط ممتد - أقوى) 💪
ماذا يحدث عند اكتشاف الضغط؟
- يرسم ثلاث خطوط أفقية:
o الخط العلوي = المقاومة (المستوى الذي يجب كسره للأعلى) ↗️
o الخط السفلي = الدعم (المستوى الذي يجب كسره للأسفل) ↘️
o الخط المنقط المركزي = المحور (النقطة الوسطى) ⚖️ - ينتظر الاختراق:
o إذا اخترق السعر المقاومة للأعلى → إشارة صعودية (مثلث أخضر) 🟢
o إذا اخترق السعر الدعم للأسفل → إشارة هبوطية (مثلث أحمر) 🔴
مرشح ذكي: 🧠
• للإشارة الصعودية: يجب أن يكون السعر أولاً أسفل المحور، ثم يرتفع
• للإشارة الهبوطية: يجب أن يكون السعر أولاً أعلى المحور، ثم ينخفض
• هذا يلغي الإشارات الخاطئة عندما يكون السعر بعيدًا بالفعل عن النطاق ❌
الجزء 2: قناة الاتجاه الانحدارية
يحسب رياضيًا خط الاتجاه الأمثل باستخدام الانحدار الخطي ويرسم قناة ديناميكية مع:
• خط مركزي سميك (أخضر إذا كان صاعدًا، أحمر إذا كان هابطًا) 🎨
- تنبيهات الاختراق 🚨
عرض إشارات الاختراق
• ما يفعله: يعرض/يخفي مثلثات الإشارة
• التأثير: إذا قمت بإلغاء تفعيله، لن ترى الأسهم لكن الصناديق والخطوط ستظل مرئية
• التوصية: دائمًا مفعّل ✅
لون اختراق الصعود/الهبوط
• ما يفعله: يغير لون إشارات الصعود/الهبوط
• التأثير: بصري فقط، لا يؤثر على الكشف
• التوصية: أخضر للصعود، أحمر للهبوط (الافتراضي) 🟢🔴 - قناة الاتجاه (Trend Channel) 📊
طريقة القناة
• الخيارات: متحركة / ثابتة
• ما يفعله:
o متحركة: القناة تتكيف شريطًا بشريط (سلسة) 🔄
o ثابتة: القناة ترسم مرة واحدة في بداية الفترة وتمتد (خط مستقيم) ➖
• التأثير: المتحركة أكثر ديناميكية، الثابتة أوضح لرؤية الاتجاه الأولي
• التوصية: المتحركة للتتبع في الوقت الحقيقي ⌚
نوع المرساة
• الخيارات: دورية / الشريط الأول
• ما يفعله:
o دورية: يعيد الحساب في كل فترة جديدة (أسبوعية، شهرية، إلخ) 📅
o الشريط الأول: يحسب من الشريط الأول على الرسم البياني (لا يعيد التعيين أبدًا) 🏁
• التأثير: الدورية تعطي قنوات نظيفة في كل فترة، الشريط الأول يظهر الاتجاه العام
• التوصية: الدورية للتحليل المنظم 🧱
فترة القناة
• ما يفعله: عدد مرات إعادة تعيين حساب القناة
• الافتراضي: أسبوعي (Weekly) 🗓️
• التأثير:
o فترات قصيرة (يومي) → القناة تتغير كثيرًا، تتبع التغيرات السريعة
o فترات طويلة (شهري) → قناة أكثر استقرارًا، تظهر الاتجاه الأساسي
• التوصية: الأسبوعي هو التوازن المثالي ⚖️
مصدر السعر
• الخيارات: إغلاق / فتح / أعلى / أدنى / نموذجي / موزون
• ما يفعله: أي سعر يستخدم لحساب القناة
• التأثير: الإغلاق هو الأكثر استخدامًا (سعر الإغلاق)، النموذجي ينعم الحساب
• التوصية: الإغلاق للدقة، النموذجي للتنعيم 🎯
مضاعف الانحراف
• ما يفعله: يضرب الانحراف المعياري لجعل القناة أوسع أو أضيق
• الافتراضي: 1.0
• التأثير:
o قيم منخفضة (0.5-0.8) → قناة ضيقة، إشارات أكثر للمس ولكن أيضًا أكثر خاطئة
o قيم عالية (1.5-2.0) → قناة واسعة، لمسات أقل ولكن أكثر موثوقية
• التوصية: 1.0 هو التوازن الأمثل ⚖️ - ألوان القناة 🎨
ألوان ديناميكية
• ما يفعله: يغير لون القناة حسب الاتجاه (أخضر إذا كان صاعدًا، أحمر إذا كان هابطًا)
• التأثير: إذا قمت بإلغاء تفعيله، يستخدم لونًا واحدًا فقط (لون الاتجاه الصاعد)
• التوصية: مفعّل لتحديد الاتجاه بسرعة 🚦
لون الاتجاه الصاعد/الهابط
• ما يفعله: يحدد ألوان الاتجاه الصاعد/الهابط
• التأثير: بصري فقط
• التوصية: أخضر/أحمر (كلاسيكي) 🟢🔴
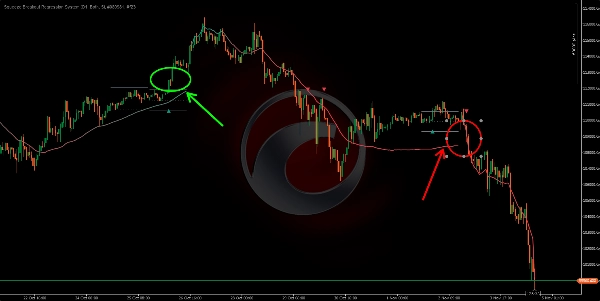
🟢 عملية شراء طويلة 📈
- اكتشاف الضغط:
• تظهر الخطوط الأفقية الثلاثة (الدعم، المحور، المقاومة)
• السعر مضغوط بين هذه المستويات - التحضير للاختراق:
• السعر أسفل المحور (الخط المنقط المركزي)
• هذا ينشط الشرط للبحث عن اختراقات صعودية - نقطة التقاء رئيسية - لحظة الدخول: 🎯
• ✅ يظهر مثلث أخضر (تم تأكيد الاختراق الصعودي) 🟢
• ✅ قناة الانحدار خضراء (تم تأكيد الاتجاه الصاعد) 📗
• ✅ السعر يخترق خط الضغط العلوي ↗️
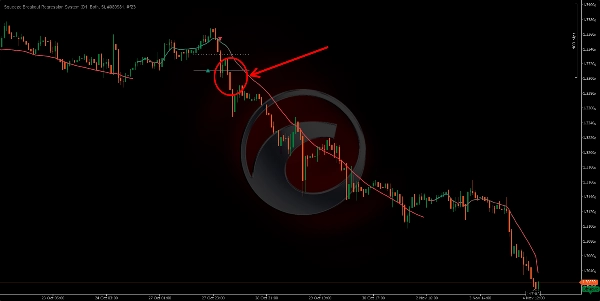
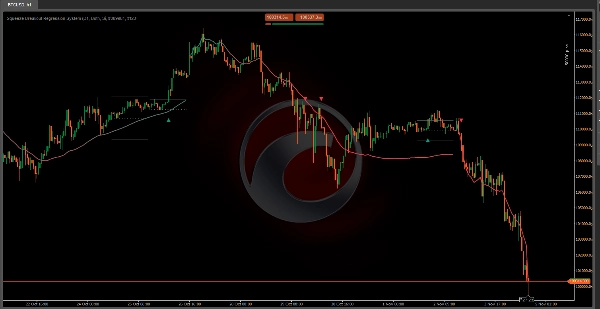
🔴 عملية بيع قصيرة 📉
- اكتشاف الضغط:
• تظهر الخطوط الأفقية الثلاثة مرة أخرى
• تم تحديد منطقة ضغط جديدة - التحضير لاختراق هبوطي:
• السعر أعلى المحور (الخط المنقط)
• هذا ينشط البحث عن اختراقات هبوطية - نقطة التقاء رئيسية - لحظة الدخول: 🎯
• ✅ يظهر مثلث أحمر (تم تأكيد الاختراق الهبوطي) 🔴
• ✅ قناة الانحدار حمراء (تم تأكيد الاتجاه الهابط) 📕
• ✅ السعر يخترق خط الضغط السفلي ↘️
الملخص
The Trend Channel System uses linear regression to calculate the dominant trend and dynamically draws a channel with color-coded trend direction (green for uptrend, red for downtrend). It offers configurable options such as rolling or static channels, periodic or continuous anchoring, channel period, price source, and deviation multiplier to adjust channel width and responsiveness.
The indicator supports breakout alerts with visual signals for bullish and bearish breakouts, aiding traders in timing entries. It is applicable across various markets including Forex, cryptocurrencies, stocks, and indices, with symbols like BTCUSD, EURUSD, GBPUSD, XAUUSD, NAS100, and USDJPY. The system integrates volatility compression detection with trend analysis to assist in identifying breakout trading opportunities.


