Beschreibung
🚀 Über 10.000 Trader nutzen bereits unsere TOP Indikatoren🏆
Entdecken Sie, warum Profis uns wählen – die leistungsstärksten Tools auf cTrader (Indikatoren, Algorithmen und cBots) warten auf Sie.
👉 Erhalten Sie hier alle unsere TOP-Systeme:
_______________________________________________
📌 Marktstruktur-Indikatoren
· ✅ AdvancedMarket Structure: Bos, Choch, SwinLevels, Order Blocks, Marktstruktur& Liquidity Finder
· 🔄 Dynamische Marktstrukturanalyse von Wendepunkten
· 🧱 Order Block
· ⚖️ Marktungleichgewicht
· ⛓️ BOS & CHOCH
· 🧠 ICT Power of 3
_______________________________________________
🔚 Intelligente Ausstiegssysteme
_______________________________________________
📐 ZigZag-Indikatoren
· 🔍 ZigZag Preis-Liquiditätsprojektion
· ➖ ZigZag
_______________________________________________
🧱 Support- & Resistance-Indikatoren
· 🟩 SmartTrend Support- & Resistance-Linien
· 🧱 Alle Support- und Resistance-Level
_______________________________________________
📊 Trend- & Kanalindikatoren
· 🔄 Auto-Trend-Kanal
· 📊 Supertrend
_______________________________________________
💧 Volumen- & Liquiditäts-Tools
_______________________________________________
⚡ Momentum- & RSI-Indikatoren
· 🚀 Dynamisches Range-Momentum
· 🔎 Multi-Level Candle Bias
Tracker
_______________________________________________
🔮 Prognose- & Projektions-Tools
· 📐 Prognose basierend auf Linreg & ATR
· 📏 Fibonacci Lineare Regression Multi-Timeframe
· 📈 Volumengetriebener Marktfluss-Projektor
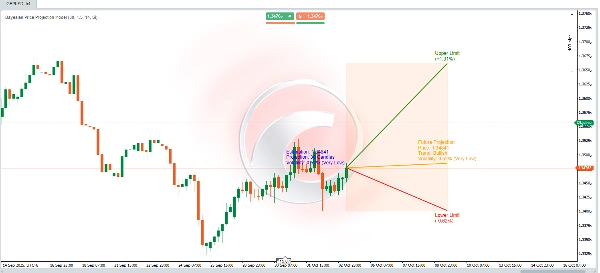
📊 Dynamischer Preisprojektion-Algorithmus 📈
Dieser Algorithmus kombiniert **statistische Berechnungen**, **technische Analyse** und **Bayessche Theorie**, um einen zukünftigen Preis vorherzusagen und dabei **Unsicherheitsbereiche** anzugeben, die obere und untere Grenzen darstellen. Die Berechnungen sind so konzipiert, dass sie Projektionen anpassen, indem sie Markt**trends**, **Volatilität** und die historischen Wahrscheinlichkeiten für das Erreichen neuer Hochs oder Tiefs berücksichtigen.
So funktioniert es:
🚀 Zukunfts-Preisprojektion
Eine dynamische Berechnung schätzt den zukünftigen Preis basierend auf drei Schlüsselelementen:
1. **Trend**: Definiert, ob der Markt dazu neigt, nach oben oder unten zu gehen.
2. **Volatilität**: Quantifiziert die Größe der erwarteten Veränderung basierend auf historischen Schwankungen.
🧠 **Bayessche Wahrscheinlichkeitsanpassung**
- Bedingte Wahrscheinlichkeiten werden mit der **Bayes-Formel** berechnet:
\[
P(A|B) = \frac{P(B|A) \cdot P(A)}{P(B)}
\]
Dies modelliert zukünftige Ereignisse unter Verwendung bedingter Informationen:
- **Wahrscheinlichkeit, ein neues Allzeithoch zu erreichen**, wenn der Preis nach oben tendiert.
- **Wahrscheinlichkeit, ein neues Allzeittief zu erreichen**, wenn der Preis nach unten tendiert.
- Diese Wahrscheinlichkeiten verfeinern die Schätzung des zukünftigen Preises, indem sie berücksichtigen:
- **Höhere Volatilität** erhöht die Wahrscheinlichkeit, extreme Niveaus (Hochs/Tiefs) zu erreichen.
- **Markttrends** beeinflussen die erwartete Richtung der Preisbewegung.
🌟 **Volatilitätsberechnung**
- Die Volatilität wird mit dem **ATR (Average True Range)** Indikator über ein 14-Perioden-Fenster gemessen. Dies spiegelt die durchschnittliche Amplitude der Preisschwankungen wider.
- Um die Volatilität als Prozentsatz auszudrücken, wird der ATR normalisiert, indem er durch den Schlusskurs geteilt und mit 200 multipliziert wird.
- Die Volatilität wird dann in beschreibende Stufen (z. B. **Sehr niedrig**, **Niedrig**, **Mäßig** usw.) eingeteilt, um die Interpretation zu erleichtern.
---
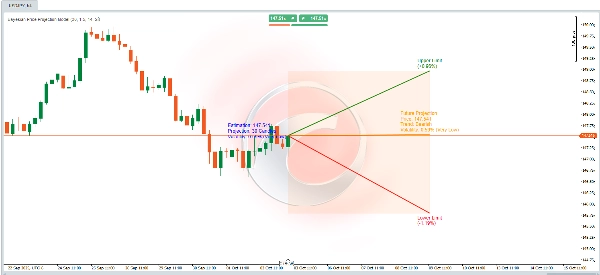
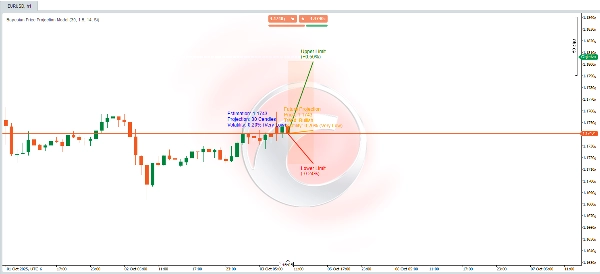
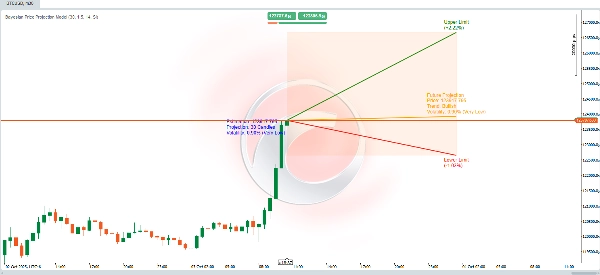
🎯 **Abweichungslimits (Obere und Untere)**
- Die oberen und unteren Grenzen bilden einen **projizierten Bereich** um den geschätzten zukünftigen Preis und bieten einen Rahmen für die Unsicherheit.
- Diese Grenzen werden berechnet, indem der ATR angepasst wird durch:
- Einen benutzerdefinierten **Multiplikator** (`factor_desviacion`).
- Die zuvor berechneten **bayesschen Wahrscheinlichkeiten**.
- Die **Quadratwurzel des projizierten Zeitraums** (`proyeccion_dias`), wobei das Prinzip berücksichtigt wird, dass die Unsicherheit mit der Zeit zunimmt.
🔍 **Interpretation des Modells**
Dies kann als ein **dynamisches probabilistisches Modell** gesehen werden, das:
- **Technische Analyse** (Trends und ATR) kombiniert.
- Wahrscheinlichkeiten mit **Bayesscher Theorie** verfeinert.
- Einen **visuellen Projektionsbereich** bietet, um potenzielle zukünftige Preisbewegungen und die damit verbundenen Unsicherheiten besser zu verstehen.
⚡ Ob Sie nun **volatile Märkte** analysieren oder **bullische/bärische Szenarien** bestätigen – dieses Tool stattet Sie mit einem robusten, datenbasierten Ansatz aus! 🚀