Beschreibung
🚀 Über 10.000 Trader nutzen bereits unsere TOP Indikatoren🏆
👉 Erhalten Sie hier alle unsere TOP-Systeme:
_______________________________________________
📌 Marktstruktur-Indikatoren
· ✅ AdvancedMarket Structure: Bos, Choch, SwinLevels, Order Blocks, Market Structure& Liquidity Finder
· 🔄 Dynamische Marktstrukturanalyse von Wendepunkten
· 🧱 Order Block
· ⚖️ Marktungleichgewicht
· ⛓️ BOS & CHOCH
· 🧠 ICT Power of 3
_______________________________________________
🔚 Intelligente Ausstiegssysteme
_______________________________________________
📐 ZigZag-Indikatoren
· 🔍 ZigZag Preis-Liquiditätsprojektion
· ➖ ZigZag
_______________________________________________
🧱 Support- & Resistance-Indikatoren
· 🟩 SmartTrend Support- & Resistance-Linien
· 🧱 Alle Support- und Resistance-Level
_______________________________________________
📊 Trend- & Kanalindikatoren
· 🔄 Auto-Trend-Kanal
· 📊 Supertrend
_______________________________________________
💧 Volumen- & Liquiditätswerkzeuge
_______________________________________________
⚡ Momentum- & RSI-Indikatoren
· 🚀 Dynamisches Range-Momentum
· 🔎 Multi-Level Candle Bias
Tracker
_______________________________________________
🔮 Prognose- & Projektionswerkzeuge
· 📐 Prognose basierend auf Linreg& ATR
· 📏 Fibonacci Lineare Regression Multi-Timeframe
· 📈 Volumengetriebener Marktfluss-Projektor
📊 Pivot Breakout Detector
🎯 **Was ist das und wofür ist es?**
https://ctrader.chartshots.net/c/68e935cb9f52a
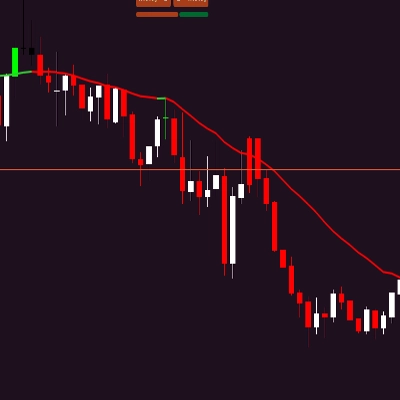
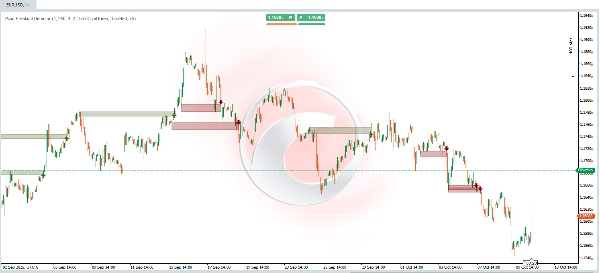
Der Pivot Breakout Detector ist ein fortschrittlicher technischer Indikator, der entwickelt wurde, um automatisch bedeutende Ausbrüche aus Preis-Konsolidierungszonen zu erkennen. Dieser Indikator analysiert das historische Marktverhalten, um Bereiche zu identifizieren, in denen der Preis wiederholt „abprallte“ (wodurch Widerstand oder Unterstützung entsteht) und warnt Sie, wenn ein Ausbruch mit Momentum schließlich eintritt.
**Hauptnutzen:**
• Handelsmöglichkeiten bei bestätigten Ausbrüchen identifizieren
• Falsche Ausbrüche durch Mehrfachkontakt-Validierung vermeiden
• Kritische dynamische Unterstützungs- und Widerstandszonen visualisieren
• Explosive Bewegungen nach Konsolidierungen erfassen
________________________________________
🔍 **Wie funktioniert es? - Die zugrunde liegende Logik**
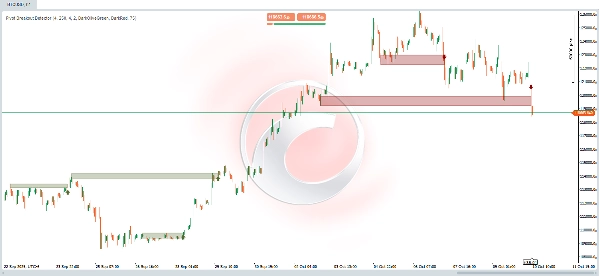
**Phase 1: Erkennung signifikanter Pivots**
https://ctrader.chartshots.net/c/68e9368eb6e7c
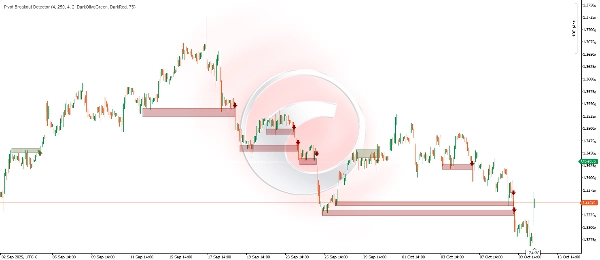
Der Indikator scannt ständig das Chart auf Pivot-Punkte – lokale Hochs und Tiefs, die den Punkt markieren, an dem der Preis die Richtung änderte. Diese Pivots sind grundlegend, da sie Niveaus markieren, an denen historisch Käufer- oder Verkäuferinteresse bestand.
**Phase 2: Identifikation von Konsolidierungszonen**
Sobald Pivots erkannt werden, gruppiert der Indikator jene, die nahe beieinander liegen (innerhalb eines konfigurierbaren Schwellenwerts). Wenn mehrere Pivots in einem engen Preisbereich konzentriert sind, deutet dies auf eine Konsolidierungszone hin – einen Bereich, in dem der Preis wiederholt abgewiesen wurde.
**Phase 3: Ausbruchbestätigung**
Der Indikator wartet geduldig, bis der Preis es schafft:
1. Über (bullischer Ausbruch) oder unter (bärischer Ausbruch) die identifizierte Zone zu schließen
2. Dies mit einer starken Richtungs-Kerze zu tun (Schlusskurs weit vom Eröffnungskurs entfernt)
3. Das jüngste kurzfristige Hoch/Tief zu übertreffen
**Phase 4: Endgültige Validierung**
Bevor das Signal generiert wird, überprüft er, dass:
• Es genügend vorherige „Berührungen“ in der Zone gibt (konfigurierbares Minimum)
• Der Preis dieses Niveau nicht kürzlich überschritten hat
• Die Eröffnung der Ausbruchskerze innerhalb des gültigen Bereichs liegt
________________________________________
📈 **Visuelle Interpretation**
**Elemente im Chart:**
🟢 **Olivgrüne Rechtecke (bullischer Ausbruch)**
• Schattierter grüner Bereich: Stellt den überwundenen Widerstandsbereich dar
• Obere und untere Grenzen: Begrenzen die vorherige Konsolidierungszone
• Horizontale Ausdehnung: Zeigt vom Zeitpunkt der Zonierung bis zum Ausbruch
🔴 **Dunkelrote Rechtecke (bärischer Ausbruch)**
• Schattierter roter Bereich: Stellt den durchbrochenen Unterstützungsbereich dar
• Funktion: Entspricht den grünen Rechtecken, jedoch für bärische Bewegungen
⬆️ **Grüner Aufwärtspfeil**
• Position: Unter der Kerze, die den bullischen Ausbruch bestätigt hat
• Bedeutung: Potenzielles Long-Einstiegssignal (Kauf)
• Interpretation: Der Preis hat den Widerstand mit Kraft durchbrochen
⬇️ **Roter Abwärtspfeil**
• Position: Über der Kerze, die den bärischen Ausbruch bestätigt hat
• Bedeutung: Potenzielles Short-Einstiegssignal (Verkauf)
• Interpretation: Der Preis hat die Unterstützung mit Kraft durchbrochen
________________________________________
⚙️ **Konfigurierbare Parameter**
1. **Swing Detection Length (Standard: 4)**
• Was es steuert: Analysezeitraum zur Erkennung signifikanter Pivots
• Niedrige Werte (2-3): Erkennt kleinere und häufigere Pivots, erzeugt mehr Signale, aber potenziell mehr falsche
• Hohe Werte (7-10): Erkennt nur größere und zuverlässigere Pivots, erzeugt weniger, aber qualitativ hochwertigere Signale
• Empfehlung: 4 für Tageshandel, 8-10 für Swing-Trading
2. **Zone History Bars (Standard: 250)**
• Was es steuert: Wie viele Kerzen zurück der Indikator Pivots „erinnert“, um Zonen zu bilden
• Niedrige Werte (30-100): Fokus auf aktuelle Zonen, reaktiver auf Strukturänderungen
• Hohe Werte (200-300): Berücksichtigt ältere historische Zonen, nützlich zur Identifikation langfristiger Niveaus
• Empfehlung: 150-200 für Intraday-Zeiträume, 250-300 für Tages- oder höhere Zeitrahmen
3. **Zone Width Percent (Standard: 4%)**
• Was es steuert: Die Breite des „Toleranzbereichs“ zur Gruppierung von Pivots in einer Zone
• Niedrige Werte (1-2%): Sehr präzise Zonen, erfordert mehrere fast exakte Berührungen
• Hohe Werte (5-8%): Breitere Zonen, großzügiger bei der Gruppierung nahe beieinander liegender Niveaus
• Empfehlung: 2-3% für Instrumente mit niedriger Volatilität (Forex Majors), 4-6% für Kryptowährungen
4. **Min Swing Touches (Standard: 2)**
• Was es steuert: Minimale Anzahl der Male, die der Preis die Zone „getestet“ haben muss, bevor sie als gültig gilt
• Niedrige Werte (1-2): Mehr Signale, auch weniger etablierte Zonen
• Hohe Werte (3-5): Nur stark bestätigte Zonen, weniger Signale, aber zuverlässiger
• Empfehlung: 2 für aktiven Handel, 3-4 für konservativere Positionen
________________________________________
📊 **Praktische Beispiele**
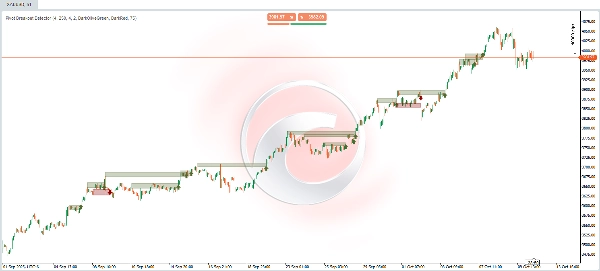
🔵 **Beispiel für bullischen Ausbruch**
**Vorheriger Kontext:** Der Preis schwankte mehrere Sitzungen lang zwischen 48,50 $ und 49,20 $. Während dieser Konsolidierungsphase versuchte der Preis dreimal, die Marke von 49,00 $ zu überschreiten, wurde jedoch jedes Mal abgewiesen, wodurch hohe Pivots praktisch auf demselben Niveau entstanden.
**Zonenbildung:** Der Indikator identifiziert automatisch diese drei hohen Pivots, die zwischen 48,90 $ und 49,10 $ konzentriert sind, und schafft eine klar definierte „Widerstandszone“. Diese Zone wird als halbtransparentes olivgrünes Rechteck dargestellt, das sich horizontal vom ersten Kontakt bis zur Gegenwart erstreckt.
**Ausbruchsmoment:** In der aktuellen Sitzung öffnet der Preis bei 48,80 $, steigt stark an und schließt bei 49,35 $. Diese Kerze erfüllt alle Kriterien:
• ✅ Schließt über der Widerstandszone (49,10 $)
• ✅ Es ist eine starke bullische Kerze (Schlusskurs deutlich über Eröffnung)
• ✅ Übertrifft das Hoch der letzten 4 vorherigen Kerzen
• ✅ Die Zone hatte mindestens 2-3 bestätigte Berührungen
**Generiertes Signal:** Ein grüner Pfeil, der nach oben zeigt, erscheint unter der Ausbruchskerze, und das olivgrüne Rechteck „schließt“ in diesem Moment, wodurch die gesamte Struktur visuell dargestellt wird: von der Bildung des Widerstands bis zu dessen Durchbruch.
**Trader-Interpretation:** Dies ist ein potenzielles Kaufsignal. Der Ausbruch deutet darauf hin, dass Käufer den Widerstand, der den Preis bisher gehalten hatte, überwunden haben, und eine nachhaltigere bullische Bewegung beginnen könnte. Trader könnten in Betracht ziehen:
• Long-Einstieg beim Schlusskurs der Kerze oder bei einem Rücksetzer zur durchbrochenen Zone (jetzt Unterstützung)
• Stop-Loss unterhalb der Zone (48,70 $)
• Ziel basierend auf der Höhe der Zone, nach oben projiziert
________________________________________
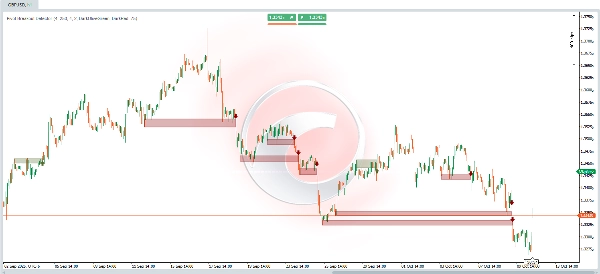
🔴 **Beispiel für bärischen Ausbruch**
**Vorheriger Kontext:** Der Preis befand sich fast zwei Wochen lang in einer Distributionsphase um 102,00 $. An vier verschiedenen Gelegenheiten versuchte der Preis, unter 101,50 $ zu fallen, wurde jedoch von Käufern gestützt, wodurch niedrige Pivots in einer sehr engen Zone entstanden.
**Zonenbildung:** Der Indikator erkennt diese vier niedrigen Pivots, die zwischen 101,40 $ und 101,70 $ gruppiert sind, und identifiziert eine klare institutionelle „Unterstützungszone“. Der Bereich wird mit einem halbtransparenten roten Rechteck markiert, das die gesamte Verteidigungshistorie auf diesem Niveau dokumentiert.
**Ausbruchsmoment:** Während einer volatilen Sitzung öffnet der Preis bei 101,80 $, negative Nachrichten treffen den Markt, und der Preis bricht ein und schließt bei 100,95 $. Diese Ausbruchskerze zeigt:
• ✅ Schließt deutlich unter der Unterstützungszone (101,40 $)
• ✅ Es ist eine starke bärische Kerze (Schlusskurs deutlich unter Eröffnung)
• ✅ Durchbricht das Tief der letzten 4 Sitzungen
• ✅ Die Unterstützung wurde zuvor 4-mal getestet
**Generiertes Signal:** Ein roter Pfeil, der nach unten zeigt, erscheint über der Ausbruchskerze. Das dunkelrote Rechteck wird vervollständigt und dokumentiert visuell die gesamte Entstehungszeit und den genauen Punkt des Unterstützungszusammenbruchs.
**Trader-Interpretation:** Dies ist ein potenzielles Verkaufssignal. Der Ausbruch zeigt, dass Verkäufer endlich den Boden durchbrochen haben, der den Preis stützte, was auf eine Fortsetzung des bärischen Trends hindeuten könnte. Zu berücksichtigen sind:
• Short-Einstieg beim Schlusskurs oder bei einem gescheiterten Rücksetzer zur durchbrochenen Zone (jetzt Widerstand)
• Stop-Loss oberhalb der Zone (102,00 $)
• Ziel berechnet durch Projektion der Höhe der Zone nach unten
________________________________________
💡 **Nutzungstipps**
✅ **Beste Praktiken:**
1. Bestätigung mit Volumen: Echte Ausbrüche gehen meist mit einem Volumenanstieg einher
2. Trendkontext: Ausbrüche in Richtung des Haupttrends haben eine höhere Erfolgswahrscheinlichkeit
3. Wartezeit: Nicht alle Signale müssen sofort gehandelt werden; bei Bedarf auf zusätzliche Bestätigung warten
4. Risikomanagement: Immer einen Stop-Loss basierend auf der Struktur der durchbrochenen Zone verwenden
Zusammenfassung
Key features include:
- Automatic detection of significant pivot points and consolidation zones.
- Breakout confirmation based on candle strength and price action.
- Validation requiring multiple prior touches of the zone to reduce false signals.
- Visual cues on the chart: olive green rectangles and upward arrows for bullish breakouts; dark red rectangles and downward arrows for bearish breakouts.
- Configurable parameters such as swing detection length, zone history depth, zone width, and minimum touches to tailor sensitivity and reliability.
The indicator supports various markets including Forex, cryptocurrencies, stocks, and major symbols like BTCUSD, EURUSD, GBPUSD, XAUUSD, and NAS100. It aids traders in spotting confirmed breakout opportunities, visualizing critical price levels, and managing risk with structural stop-loss placement.