
Descrição
Indicadores da Loja Pinescriptlabs: cBots da Loja Pinescriptlabs : (cBot) Gold & BTC BreakoutSession Pivots(novo)
PRICE ACTION (Novo)
Trailing Smart Algorithm (Novo)
Mapa de Liquidação de Alavancagem
Previsão Baseada em Linreg & ATR
Suporte & Resistência SmartTrend
Linhas
de
Sistema de Rompimento de Canal
Análise
Dinâmica da Estrutura
de Mercado
dos
Pontos
de Virada
Regressão
Linear
Fibonacci
Multi-temporal
Gap de Valor Justo de Momentum
Gradiente de Tendência Dinâmico
Rastreador de
Tendência de Vela
Multi-Nível
Rastreador de Extremos Zig-Zag
Linhas de
Tendência de Suporte e
Resistência
Automáticas
Todos os
Níveis de Suporte e
Resistência
Automáticos
Descrição:
Sistema Avançado de Compra e Venda de Tendência HTF
O que é e para que serve?
É um algoritmo de análise técnica que identifica automaticamente níveis de suporte e resistência 📈 com base em faixas históricas de preço, e detecta quando o preço rompe esses níveis para gerar sinais de tendência 💡.
Como funciona a lógica?
1️⃣ Cálculo da Faixa
O indicador analisa um período histórico definido (totalmente configurável) para encontrar:
• O preço mais alto alcançado nesse período 📊
• O preço mais baixo alcançado nesse período 📉
• O ponto médio entre ambos os níveis ⚖️
2️⃣ Estabelecimento de Níveis
Uma vez identificados os extremos, o indicador:
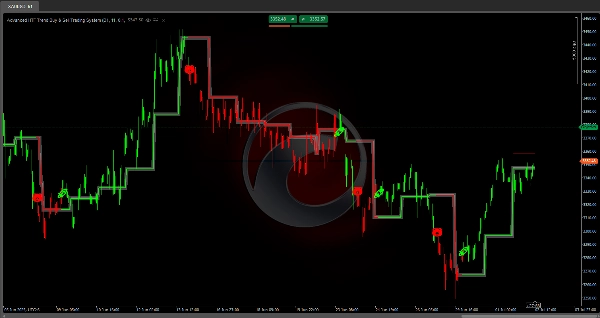
• Desenha uma linha vermelha no nível máximo (resistência)
• Desenha uma linha verde no nível mínimo (suporte)
• Adiciona um buffer de segurança a cada nível para evitar sinais falsos 🛡️
3️⃣ Detecção de Rompimento
O sistema monitora constantemente o preço para detectar:
• Rompimento de alta 🚀: quando o preço fecha acima do nível de resistência + buffer
• Rompimento de baixa 🐻: quando o preço fecha abaixo do nível de suporte - buffer
4️⃣ Sistema de Confirmação
Antes de gerar um sinal final ✅, o indicador:
• Aguarda um número configurável de barras consecutivas confirmando o rompimento ⏳
• Só após a confirmação é que muda oficialmente a tendência
5️⃣ Atualização Dinâmica
Os níveis são recalculados automaticamente:
• Quando um novo período começa (diário, semanal ou mensal, dependendo das suas configurações) 🔄
• As linhas se estendem até que novos níveis sejam definidos
• A linha do ponto médio muda de cor conforme a tendência atual
Como usar o ?
✨ Sinais:
• Comprar: O símbolo 🚀 aparece quando um rompimento de alta é confirmado
• Vender: O símbolo 🐻 aparece quando um rompimento de baixa é confirmado
🎨 Coloração das Velas:
• As velas são automaticamente coloridas conforme a tendência atual:
✅ Verde: Tendência de alta ativa
❌ Vermelho: Tendência de baixa ativa
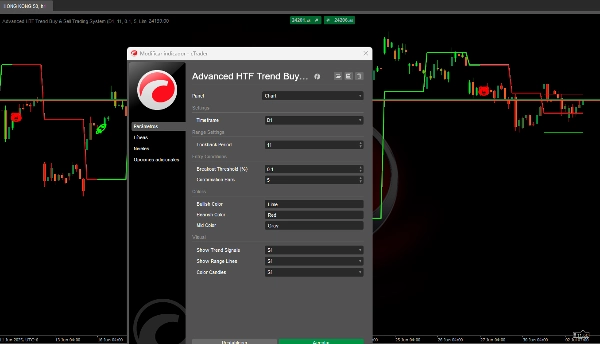
Configurações de Parâmetros
🔧 Período de Retrospectiva (5–200, padrão: 11)
O que controla?
O número de barras históricas usadas para calcular máximas e mínimas.
Impacto ao modificar:
• Valores baixos (5–15):
- Níveis mais reativos e frequentes
- Maior número de sinais
- Melhor para scalping e operações de curto prazo
- Ideal para mercados altamente voláteis
• Valores altos (30–50):
- Níveis mais estáveis e duradouros 🏛️
- Menos sinais, porém mais confiáveis
- Melhor para swing trading e posições de médio prazo
- Ideal para mercados mais estáveis
📏 Limite de Rompimento (0.01–5.0%, padrão: 0.1%)
O que controla?
O buffer extra que o preço deve ultrapassar para confirmar um rompimento.
Impacto ao modificar:
• Valores baixos (0.05–0.15%):
- Sinais mais precoces e sensíveis 🔍
- Maior risco de falsos rompimentos
- Ideal para Forex majors com spreads baixos
- Melhor para mercados de alta liquidez
• Valores altos (0.3–1.0%):
- Sinais mais tardios, porém mais confiáveis 🛡️
- Menor risco de ruído de mercado
- Ideal para criptomoedas e ativos voláteis
- Melhor para mercados com spreads mais amplos
⏳ Barras de Confirmação (1–5, padrão: 1)
O que controla?
Quantas barras consecutivas devem confirmar o rompimento antes de gerar um sinal.
Impacto ao modificar:
• 1 barra:
- Sinais instantâneos ⚡
- Mais oportunidades de negociação
- Maior risco de sinais prematuros
- Ideal para traders ativos
• 2–3 barras:
- Equilíbrio entre velocidade e confiabilidade ⚖️
- Reduz significativamente sinais falsos
- Ideal para a maioria das estratégias
• 4–5 barras:
- Sinais muito conservadores 🕊️
- Máxima confiabilidade
- Pode perder oportunidades iniciais
- Ideal para posições de longo prazo
📊 Otimização por Tipo de Ativo
💱 Forex Majors (EUR/USD, GBP/USD, etc.)
• Retrospectiva: 15–25
• Limite: 0.05–0.15%
• Confirmação: 1–2 barras
💰 Criptomoedas
• Retrospectiva: 10–20
• Limite: 0.2–0.8%
• Confirmação: 2–3 barras
📈 Índices de Ações
• Retrospectiva: 20–30
• Limite: 0.1–0.3%
• Confirmação: 1–2 barras
🌾 Commodities
• Retrospectiva: 25–35
• Limite: 0.15–0.4%
• Confirmação: 2–3 barras
Considerações
• Pode gerar sinais tardios em mercados muito rápidos 🏃♂️
• Menos eficaz em mercados extremamente laterais
• Requer ajustes de parâmetros dependendo do ativo e do timeframe ⏱️
Resumo
The system continuously monitors price action to detect bullish breakouts (price closing above resistance plus buffer) and bearish breakouts (price closing below support minus buffer). It includes a confirmation mechanism that waits for a configurable number of consecutive bars confirming the breakout before officially signaling a trend change. The midpoint line changes color to reflect the current trend, and all levels update dynamically at the start of new periods (daily, weekly, or monthly).
Signals are visually indicated with symbols: a rocket (🚀) for confirmed bullish breakouts and a bear (🐻) for confirmed bearish breakouts. Candles are colored green for active bullish trends and red for bearish trends.
Key adjustable parameters include lookback period (5–200 bars), breakout threshold buffer (0.01–5.0%), and confirmation bars (1–5). These settings can be optimized for various asset types such as Forex majors, cryptocurrencies, stock indices, and commodities, balancing signal frequency, reliability, and market conditions. The indicator supports multiple timeframes and is suitable for scalping, swing trading, and longer-term strategies depending on configuration.