Descripción
Media móvil basada en la eficiencia que ajusta la velocidad de suavizado dinámicamente según las condiciones del mercado.
Calcula el suavizado mediante el Ratio de Eficiencia (movimiento direccional frente a la volatilidad total), respondiendo rápidamente en tendencias y aplanándose durante el ruido para evitar señales falsas.
Visualización de color de tres estados (Verde tendencia alcista, Rojo tendencia bajista, Azul claro rango), parámetros de sensibilidad configurables (Periodo, suavizado rápido/lento, umbral ER), cambio automático entre modos rápido y lento, y comportamiento dinámico de soporte/resistencia que ofrecen un seguimiento adaptativo de la tendencia para traders que necesitan capacidad de respuesta en mercados direccionales y estabilidad durante la consolidación.
CARACTERÍSTICAS
Algoritmo Adaptativo
- La velocidad de suavizado cambia según el Ratio de Eficiencia (ER)—la proporción de movimiento direccional frente a la volatilidad total
- Responde rápidamente cuando la eficiencia aumenta
- Se aplana cuando el precio es ruidoso para evitar señales falsas
- Distancia dinámica del precio basada en el comportamiento del mercado
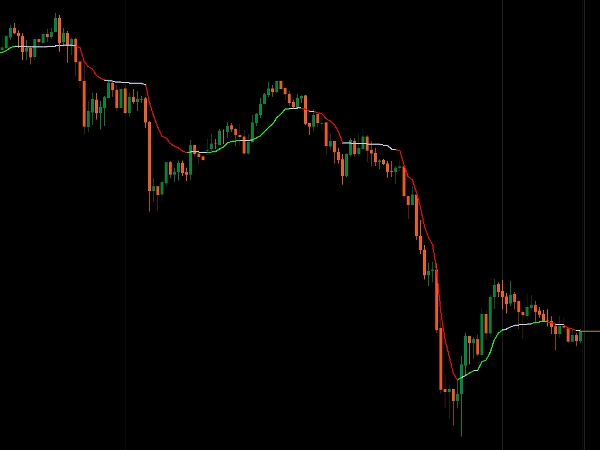
Visualización de Tres Estados
- Verde: Fuerte tendencia alcista (ER por encima del umbral + en ascenso)
- Rojo: Fuerte tendencia bajista (ER por encima del umbral + en descenso)
- Azul Claro: Rango/mercado inestable (ER por debajo del umbral)
- Confirmación visual instantánea de las condiciones del mercado
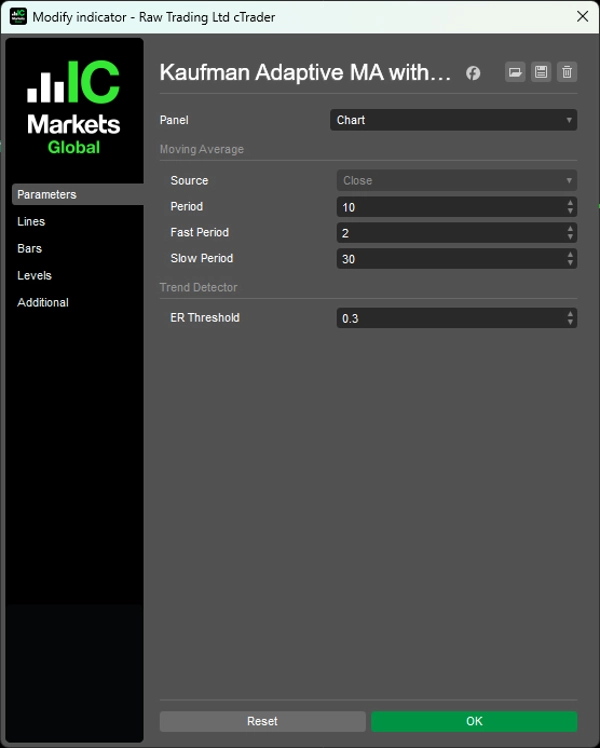
Sensibilidad Configurable
- Periodo: Retroceso para el cálculo de eficiencia (predeterminado: 10)
- Periodo Rápido: Suavizado en tendencias fuertes (predeterminado: 2)
- Periodo Lento: Suavizado en mercados en rango (predeterminado: 30)
- Umbral ER: Eficiencia mínima para calificar como tendencia (predeterminado: 0.3)
Adaptación Inteligente
- Cambia automáticamente entre suavizado rápido y lento
- Filtra el ruido en mercados inestables
- Detecta tendencias temprano cuando las condiciones cambian
- Funciona como soporte/resistencia dinámico
__________________________________________________________________________________________
MÁS INDICADORES GRATUITOS
Explora una amplia gama de herramientas de análisis de mercado—desde estructura y volumen hasta regresión, volatilidad y marcos temporales personalizados.
El código fuente está disponible en el repositorio de GitHub repository.
Todos son gratuitos para usar. Pero si deseas apoyar con un café, puedes hacerlo aquí.
Soporte/Resistencia
Volumen
- Perfilador de Actividad de Volumen
- Analizador de Eficiencia de Volumen
- Análisis de Perfil de Volumen
- Perfil de Volumen - Actualizado
- Análisis de Distribución de Volumen
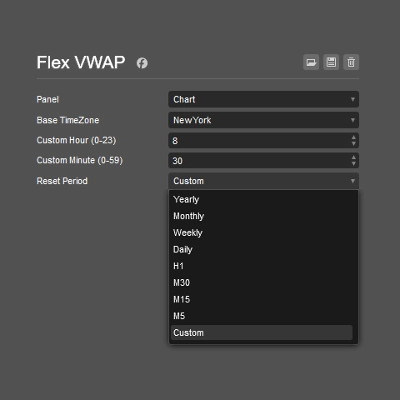
- VWAP (Precio Promedio Ponderado por Volumen)
Medias Móviles
- Canal SSL
- Media Móvil Anclada
- Media Móvil Escalada por Desviación
- Activador Gann High Low
- Línea de Tendencia Instantánea
- Media Móvil Adaptativa de Kaufman con Visión de Tendencia
- Canal de Media Móvil
- Suite de Medias Móviles
- Media Móvil de Canal de Tendencia
Utilidades/Personalizados
Basado en Regresión
Volatilidad
Osciladores
__________________________________________________________________________________________
DESCARGO DE RESPONSABILIDAD
El trading implica riesgos. Este indicador está destinado solo para análisis técnico — siempre aplique una gestión adecuada del riesgo y opere con responsabilidad.
RETROALIMENTACIÓN Y MEJORAS
Si tienes sugerencias, solicitudes de funciones o ideas para mejoras, por favor deja un comentario en la pestaña de Discusión. Tu retroalimentación ayuda a mejorar el indicador para todos.
Resumen
Key features include a three-state color-coded visualization: green for strong uptrends, red for strong downtrends, and light blue for ranging or choppy markets, providing immediate visual insight into market states. Users can configure sensitivity parameters such as lookback period, fast and slow smoothing periods, and the ER threshold to tailor responsiveness.
The indicator automatically switches between fast and slow smoothing modes, adapting to changing market behavior. It also acts as a dynamic support and resistance tool, helping traders identify trend shifts early while filtering out noise in consolidation phases. This adaptive approach supports scalping and other trading strategies requiring both responsiveness and stability in directional and ranging markets.