
Description
🚀 Plus de 10 000 traders utilisent déjà nos MEILLEURS indicateurs🏆
👉 Obtenez tous nos MEILLEURS systèmes ici :
_______________________________________________
📌 Indicateurs de Structure de Marché
· 🔄 Analyse Dynamique de la Structure de Marché des Points de Renversement
· 🧱 Bloc d'Ordre
· ⛓️ BOS & CHOCH
· 🧠 ICT Power of 3
· 🌀 Zones de Polarité du Marché
_______________________________________________
🔚 Systèmes de Sortie Intelligents
· 📍 Algorithme Intelligent de Trailing
_______________________________________________
📐 Indicateurs ZigZag
· 🔍 Projection de Liquidité du Prix ZigZag
· ➖ ZigZag
_______________________________________________
🧱 Indicateurs de Support & Résistance
· 🟩 Lignes de Support & Résistance SmartTrend
· 🧱 Tous les Niveaux de Support et Résistance
_______________________________________________
📊 Indicateurs de Tendance & Canal
· 🔄 Canal de Tendance Automatique
· 📊 Supertrend
· ⚡Analyseur de Tendance Momentum
· 🧠 Canal de Tendance Adaptatif
· 💥 Système de Cassure de Canal
· 🌈 Gradient de Tendance Dynamique
_______________________________________________
💧 Outils de Volume & Liquidité
· 🔥 Carte Thermique Volume POC
· 📉 Carte de Liquidation à Effet de Levier
· 🕒 Sessions de Fair Value Gap
_______________________________________________
⚡ Indicateurs Momentum & RSI
· 📈 Déclencheur de Tendance RSI
· 🚀 Momentum de Plage Dynamique
· 🔎 Suivi Multi-Niveaux de Biais de Chandelle
Tracker
_______________________________________________
🔮 Outils de Prédiction & Projection
· 📐 Prédiction Basée sur Linreg& ATR
· 📏 Régression Linéaire Fibonacci Multi-échelles
· 📈 Projecteur de Flux de Marché Alimenté par le Volume
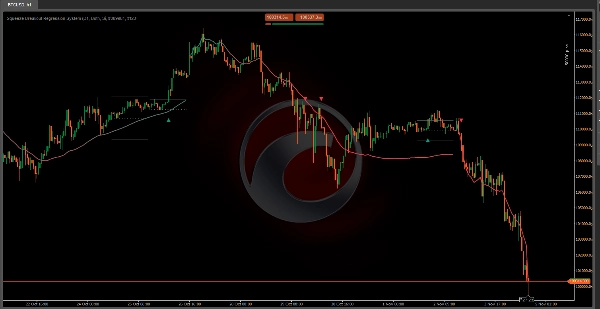
📊 Squeeze Breakout Regression System -🚀
🎯 Qu'est-ce que c'est et à quoi ça sert ? ❓
Cet indicateur combine deux systèmes complémentaires pour identifier des opportunités de trading à haute probabilité :
- Système Squeeze (Compression de Volatilité) : 🔍 Détecte les moments où le marché est "compressé" et sur le point d'exploser dans n'importe quelle direction 💥
- Système de Canal de Tendance (Régression Linéaire) : 📈 Montre la tendance dominante et ses limites dynamiques de support/résistance
🔍 Comment ça fonctionne ? ⚙️
PARTIE 1 : Détection du Squeeze
L'indicateur analyse un timeframe supérieur (par défaut : Journalier) et cherche les chandelles dont la plage (différence entre le plus haut et le plus bas) est la plus petite dans :
• 7 périodes = "Short Squeeze" (compression courte)
• 10 périodes = "Extended Squeeze" (compression prolongée - plus forte) 💪
Que se passe-t-il lorsqu'il détecte un Squeeze ?
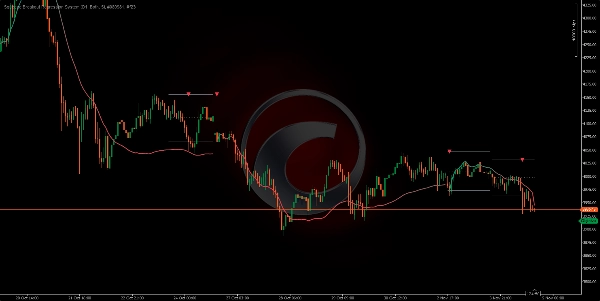
- Il trace trois lignes horizontales :
o Ligne supérieure = Résistance (niveau à franchir à la hausse) ↗️
o Ligne inférieure = Support (niveau à franchir à la baisse) ↘️
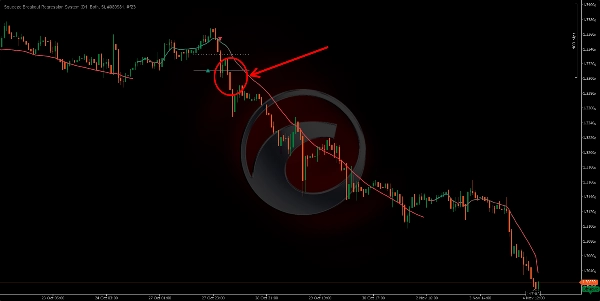
o Ligne pointillée centrale = Pivot (point médian) ⚖️ - Il attend la cassure :
o Si le prix casse la résistance à la hausse → Signal HAUSSIER (triangle vert) 🟢
o Si le prix casse le support à la baisse → Signal BAISSIER (triangle rouge) 🔴
Filtre intelligent : 🧠
• Pour un signal haussier : Le prix doit d'abord être en dessous du pivot, puis monter
• Pour un signal baissier : Le prix doit d'abord être au-dessus du pivot, puis descendre
• Cela élimine les faux signaux lorsque le prix est déjà loin de la plage ❌
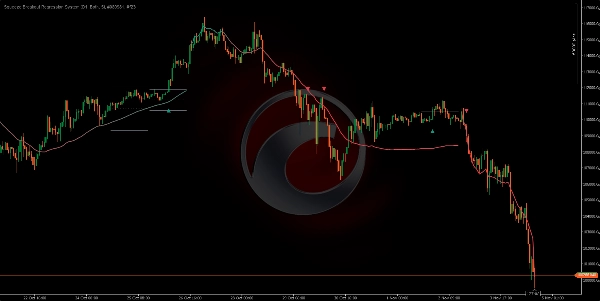
PARTIE 2 : Canal de Tendance par Régression
Il calcule mathématiquement la ligne de tendance optimale en utilisant la régression linéaire et trace un canal dynamique avec :
• Ligne centrale épaisse (verte si en hausse, rouge si en baisse) 🎨
- Alertes de Cassure 🚨
Afficher les Signaux de Cassure
• Ce que ça fait : Affiche/masque les triangles de signal
• Impact : Si vous le désactivez, vous ne verrez pas les flèches mais les boîtes et lignes resteront visibles
• Recommandation : Toujours activé ✅
Couleur de Cassure Haussière/Baissière
• Ce que ça fait : Change la couleur des signaux haussiers/baissiers
• Impact : Visuel uniquement, n'affecte pas la détection
• Recommandation : Vert pour haussier, Rouge pour baissier (standard) 🟢🔴 - Canal de Tendance (Trend Channel) 📊
Méthode de Canal
• Options : Rolling / Static
• Ce que ça fait :
o Rolling : Le canal s'adapte barre par barre (fluide) 🔄
o Static : Le canal est tracé une fois au début de la période et étendu (ligne droite) ➖
• Impact : Rolling est plus dynamique, Static est plus clair pour voir la tendance initiale
• Recommandation : Rolling pour un suivi en temps réel ⌚
Type d'Ancrage
• Options : Périodique / Première Barre
• Ce que ça fait :
o Périodique : Réinitialise le calcul à chaque nouvelle période (hebdomadaire, mensuelle, etc.) 📅
o Première Barre : Calcule depuis la première barre du graphique (ne se réinitialise jamais) 🏁
• Impact : Périodique donne des canaux propres chaque période, Première Barre montre la tendance globale
• Recommandation : Périodique pour une analyse structurée 🧱
Période du Canal
• Ce que ça fait : Fréquence de réinitialisation du calcul du canal
• Par défaut : Hebdomadaire (Weekly) 🗓️
• Impact :
o Périodes courtes (Daily) → Le canal change fréquemment, suit les changements rapides
o Périodes longues (Monthly) → Canal plus stable, montre la tendance sous-jacente
• Recommandation : Hebdomadaire est l'équilibre parfait ⚖️
Source du Prix
• Options : Close / Open / High / Low / Typical / Weighted
• Ce que ça fait : Quel prix est utilisé pour calculer le canal
• Impact : Close est le plus utilisé (prix de clôture), Typical lisse le calcul
• Recommandation : Close pour la précision, Typical pour le lissage 🎯
Multiplicateur de Déviation
• Ce que ça fait : Multiplie l'écart-type pour élargir ou rétrécir le canal
• Par défaut : 1.0
• Impact :
o Valeurs basses (0.5-0.8) → Canal étroit, plus de signaux de contact mais aussi plus de faux
o Valeurs élevées (1.5-2.0) → Canal large, moins de contacts mais plus fiable
• Recommandation : 1.0 est l'équilibre optimal ⚖️ - Couleurs du Canal 🎨
Couleurs Dynamiques
• Ce que ça fait : Change la couleur du canal selon la tendance (vert si en hausse, rouge si en baisse)
• Impact : Si vous le désactivez, il utilise une seule couleur (Couleur de la Tendance Haussière)
• Recommandation : Activé pour identifier rapidement la tendance 🚦
Couleur Tendance Haussière/Baissière
• Ce que ça fait : Définit les couleurs pour la tendance haussière/baissière
• Impact : Visuel uniquement
• Recommandation : Vert/Rouge (classique) 🟢🔴
🟢 OPÉRATION LONGUE 📈
- Détection du Squeeze :
• Les 3 lignes horizontales apparaissent (support, pivot, résistance)
• Le prix est compressé entre ces niveaux - Préparation à la Cassure :
• Le prix est en dessous du pivot (ligne pointillée centrale)
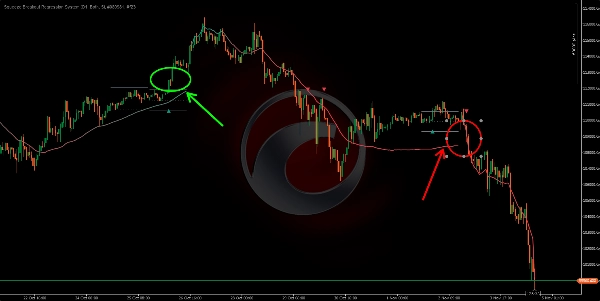
• Cela active la condition pour chercher des cassures haussières - CONFLUENCE CLÉ - Moment d'Entrée : 🎯
• ✅ Triangle vert apparaît (cassure haussière confirmée) 🟢
• ✅ Canal de Régression est VERT (tendance haussière confirmée) 📗
• ✅ Le prix casse la ligne supérieure du squeeze ↗️
🔴 OPÉRATION COURTE 📉
- Détection du Squeeze :
• Les 3 lignes horizontales réapparaissent
• Nouvelle zone de compression identifiée - Préparation à la Cassure Baissière :
• Le prix est au-dessus du pivot (ligne pointillée)
• Cela active la recherche de cassures baissières - CONFLUENCE CLÉ - Moment d'Entrée : 🎯
• ✅ Triangle rouge apparaît (cassure baissière confirmée) 🔴
• ✅ Canal de Régression est ROUGE (tendance baissière confirmée) 📕
• ✅ Le prix casse la ligne inférieure du squeeze ↘️
Résumé
The Trend Channel System uses linear regression to calculate the dominant trend and dynamically draws a channel with color-coded trend direction (green for uptrend, red for downtrend). It offers configurable options such as rolling or static channels, periodic or continuous anchoring, channel period, price source, and deviation multiplier to adjust channel width and responsiveness.
The indicator supports breakout alerts with visual signals for bullish and bearish breakouts, aiding traders in timing entries. It is applicable across various markets including Forex, cryptocurrencies, stocks, and indices, with symbols like BTCUSD, EURUSD, GBPUSD, XAUUSD, NAS100, and USDJPY. The system integrates volatility compression detection with trend analysis to assist in identifying breakout trading opportunities.


![Logo de "[Hamster-Coder] Pivot Points MTF"](https://cdn.ctrader.com/image/webp/4c143e5a-309c-40e3-a578-f04d1e133ffa_31159)

