
说明
扩展版本可用 — 这里
您当前正在查看原始版本。此指标的扩展版本已发布,具有以下附加功能:
- 增强的年龄显示:年、月、周、日格式(例如,“3年2周4天”)
- 显示所有FVG:将“显示的FVG”设置为-1以显示无限的历史FVG
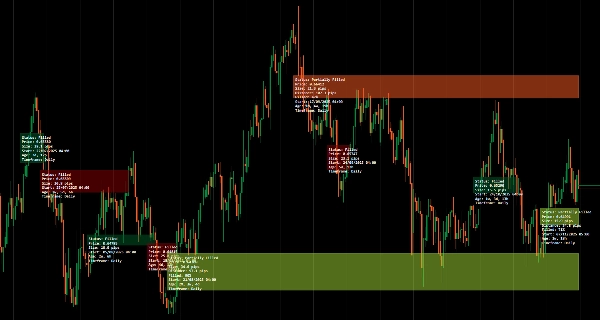
- 扩展已填充的FVG:可选将已填充的FVG框扩展到当前柱
- 斐波那契水平:部分和已填充FVG上的自动水平(23.6%、38.2%、50%、61.8%、78.6%)
- 部分填充阈值:可自定义阈值(50-99%,默认90%)
__________________________________________________________________________________________
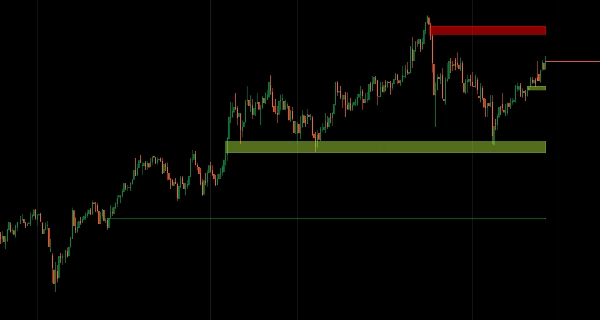
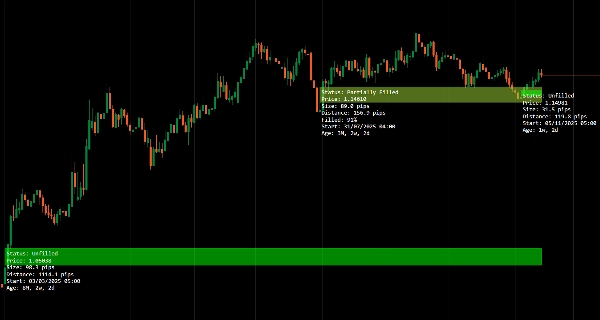
通过年龄跟踪和填充状态监控识别公平价值缺口。
自动检测看涨和看跌缺口,实时跟踪其填充行为(未填充、部分填充、完全填充),并显示缺口年龄以便优先排序。
多时间框架扫描以对齐高时间框架结构缺口与低时间框架价格动作,价格与区域交互时动态更新状态,最小化非侵入性标签,为交易者提供针对缺口填充和基于结构的入场的聚焦流动性失衡分析。
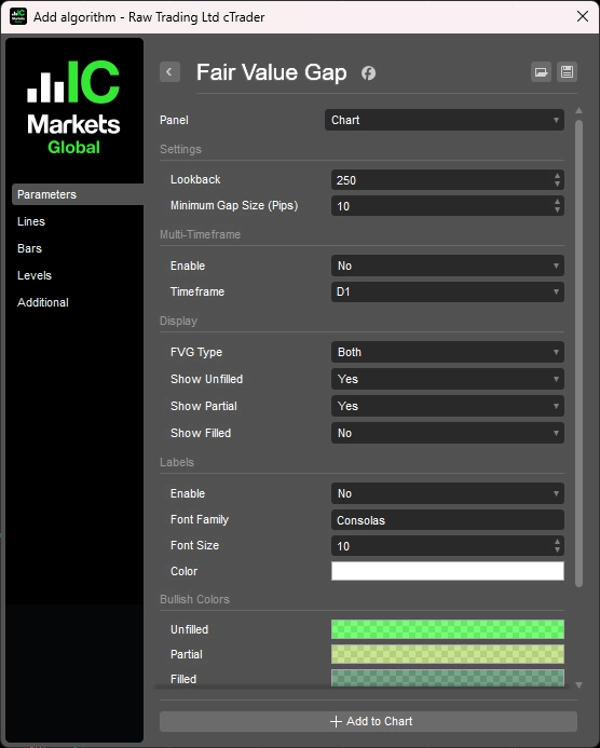
功能
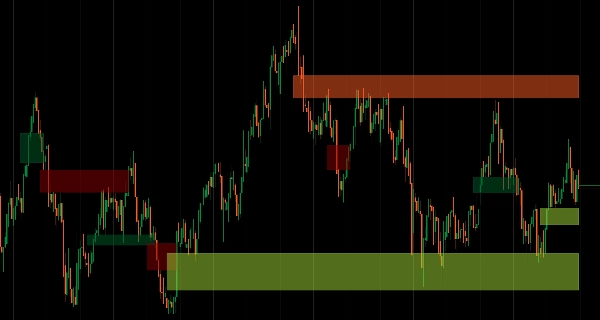
FVG识别
- 自动检测看涨和看跌公平价值缺口
- 实时跟踪未填充、部分填充和完全填充状态
- 干净的视觉绘图,图表杂乱最小化
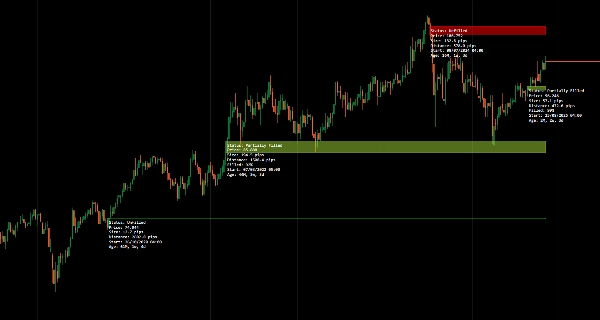
年龄标记
- 显示每个缺口形成以来经过的时间
- 帮助优先选择新鲜与陈旧缺口进行交易
- 时间上下文改善对缺口相关性的决策
状态跟踪
- 显示当前填充状态:未填充、部分填充或完全填充
- 价格与缺口交互时动态更新
- 流动性捕获的视觉确认
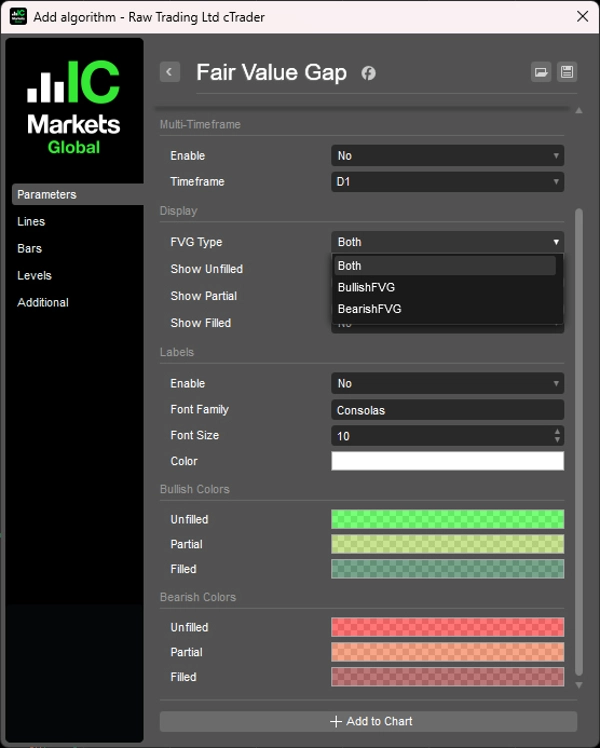
多时间框架模式
- 在较低时间框架图表上扫描并显示较高时间框架的FVG
- 对齐高时间框架结构缺口与低时间框架价格动作
- 改善多时间框架分析工作流程
简洁、极简的用户界面
- 为清晰设计的非侵入性标签
- 信息丰富且不干扰价格视图
- 专业呈现,聚焦分析
__________________________________________________________________________________________
更多免费指标
探索各种市场分析工具——从结构和成交量到回归、波动率和自定义时间框架。
源代码可在GitHub 仓库中获取。
全部免费使用。但如果您想支持喝咖啡,可以通过 这里捐助。
支撑/阻力
成交量
移动平均线
工具/自定义
基于回归
波动率
振荡器
__________________________________________________________________________________________
免责声明
交易存在风险。此指标仅用于技术分析——请始终应用适当的风险管理并负责任地交易。
反馈与改进
如果您有建议、功能请求或改进想法,请在讨论标签页留言。您的反馈有助于为所有人改进此指标。
摘要
客户评价
5 | 100 % | |
4 | 0 % | |
3 | 0 % | |
2 | 0 % | |
1 | 0 % |


