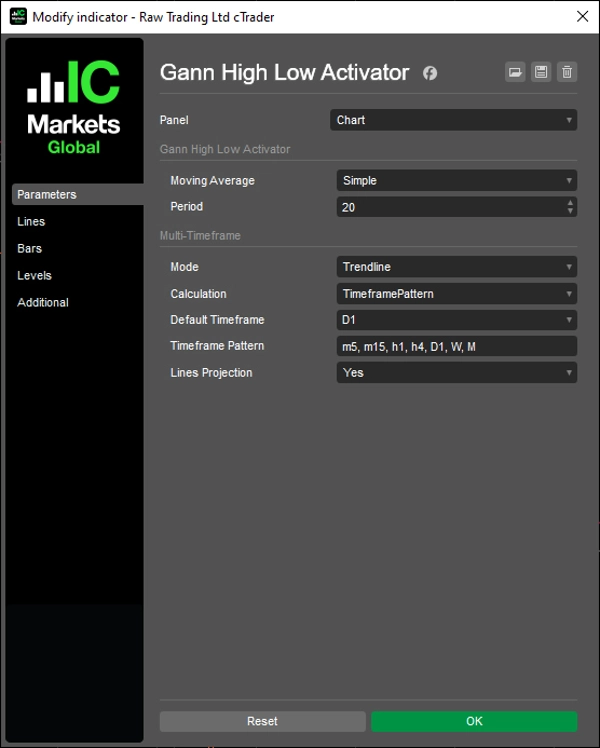
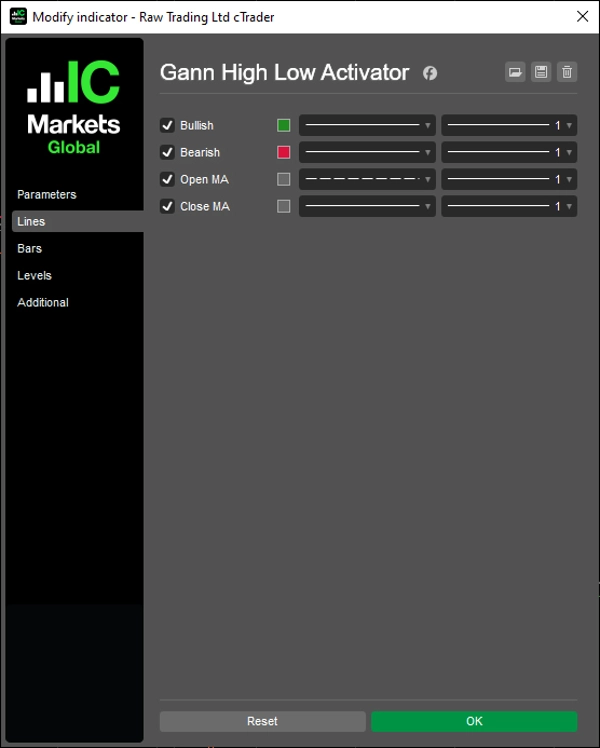
Description
Activation de tendance basée sur MA avec modes multi-échelles et projection de ligne de tendance.
Suit la direction du marché en comparant le prix de clôture aux moyennes mobiles des plus hauts et des plus bas sur une période configurable. Change d'état lorsque la clôture franchit à la hausse MA(Haut) en haussier ou à la baisse MA(Bas) en baissier — en traçant la bande opposée comme niveau de support ou de résistance actif.
Quatre modes de calcul (Aucun, Interpolé, Période Échelonnée, Ligne de Tendance), sorties MA d'ouverture et de clôture, résolution du motif de l'échelle de temps pour sélection automatique HTF, et projection de ligne de tendance pour estimation de la barre suivante fournissent un cadre complet de suivi de tendance pour les traders travaillant sur plusieurs échelles de temps et styles d'analyse.
CARACTÉRISTIQUES
Logique d'Activation Principale
- État haussier : déclenché lorsque la clôture franchit à la hausse MA(Haut) — trace MA(Bas) comme support dynamique
- État baissier : déclenché lorsque la clôture franchit à la baisse MA(Bas) — trace MA(Haut) comme résistance dynamique
- Sorties MA d'ouverture et MA de clôture pour une confluence et une analyse en superposition supplémentaires
- Prend en charge tous les types de moyennes mobiles cTrader (SMA, EMA, DEMA, TEMA, WMA, etc.)
Modes Multi-Échelles
- Aucun : calcul standard sur une seule échelle de temps sur le graphique actuel
- Interpolé : valeurs HTF lissées mappées linéairement sur les barres LTF pour une superposition continue
- Période Échelonnée : échelle la période par le ratio HTF-vers-LTF — aucune série de données supplémentaire requise
- Ligne de Tendance : dessine des objets de ligne de tendance entre les limites des barres HTF avec contrôle complet du style
Résolution de l'Échelle de Temps
- Échelle de Temps par Défaut : sélection manuelle de n'importe quel HTF dans le menu déroulant des paramètres
- Motif d'Échelle de Temps : sélection automatique de l'échelle de temps supérieure la plus proche à partir d'une liste de jetons séparés par des virgules (par exemple,
m5, m15, h1, h4, D1, W, M) - Les jetons de motif supportent les minutes (m1–m45), heures (h1–h12), jours (d1–d3), hebdomadaire (W) et mensuel (M)
Extras du Mode Ligne de Tendance
- Contrôle indépendant de la couleur, de l'épaisseur et du style par ligne de sortie
- Le basculement de visibilité reconstruit automatiquement tous les segments — pas d'objets obsolètes
- Le segment de projection étend le dernier segment HTF d'une barre vers l'avant pour anticipation
Personnalisation Complète
- Type et période MA configurables
- Style par ligne de sortie hérité par les objets de ligne de tendance en mode Ligne de Tendance
- Retour propre à l'échelle de temps actuelle lorsque HTF ≤ échelle de temps du graphique
- Contrôle de la longueur des lignes pour la gestion de la plage d'affichage
- Panneau UI sur le graphique pour ajustement des paramètres en temps réel sans ouvrir les réglages
Longueur des Lignes
- Contrôle la profondeur d'affichage des lignes — de Hour8 à Year10
S'applique à tous les modes : sorties de séries et objets de ligne de tendance
Contrôles UI
- Panneau combobox sur le graphique pour un accès rapide au type MA, mode MTF, calcul, échelle de temps et longueur des lignes
- Position configurable : TopLeft, TopRight, BottomLeft, BottomRight, ou caché (Aucun)
__________________________________________________________________________________________
PLUS D'INDICATEURS GRATUITS
Explorez une large gamme d'outils d'analyse de marché — de la structure et du volume à la régression, la volatilité et les échelles de temps personnalisées.
Le code source est disponible sur le dépôt GitHub.
Tous gratuits à utiliser. Mais si vous souhaitez offrir un café en soutien, vous pouvez le faire ici.
Support/Résistance
Volume
- Profileur d'Activité de Volume
- Analyseur d'Efficacité du Volume
- Analyse du Profil de Volume
- Profil de Volume - Mis à Jour
- Analyse de Répartition du Volume
- VWAP (Prix Moyen Pondéré par le Volume)
Moyennes Mobiles
- Canal SSL
- Moyenne Mobile Ancrée
- Moyenne Mobile Échelonnée par Écart
- Activateur Haut Bas de Gann
- Ligne de Tendance Instantanée
- MA Adaptative de Kaufman avec Vision de Tendance
- Canal de Moyenne Mobile
- Suite de Moyennes Mobiles
- Moyenne Mobile du Canal de Tendance
Utilitaires/Personnalisé
Basé sur la Régression
Volatilité
Oscillateurs
__________________________________________________________________________________________
AVERTISSEMENT
Le trading comporte des risques. Cet indicateur est destiné uniquement à l'analyse technique — appliquez toujours une gestion des risques appropriée et tradez de manière responsable.
RETROACTION & AMÉLIORATIONS
Si vous avez des suggestions, des demandes de fonctionnalités ou des idées d'amélioration, veuillez laisser un commentaire dans l'onglet Discussion. Vos retours aident à améliorer l'indicateur pour tous.
Résumé
Key features include four multi-timeframe calculation modes—None (single timeframe), Interpolated (smoothed higher timeframe values), ScaledPeriod (period scaled by timeframe ratio), and Trendline (trendline objects between higher timeframe bars with style control). It supports all cTrader MA types (SMA, EMA, DEMA, TEMA, WMA, etc.) and offers Open and Close MA outputs for additional analysis.
Timeframe resolution options allow manual or automatic selection of higher timeframes based on customizable token patterns. Trendline mode provides independent styling and projects the trendline forward by one bar for anticipation. The indicator includes extensive customization for MA type, period, line styles, display length, and an on-chart UI panel for runtime parameter adjustments. It is suitable for traders applying trend-following techniques across multiple symbols and timeframes.


![Logo de "[Hamster-Coder] Pivot Points (Demo)"](https://cdn.ctrader.com/image/webp/87b54299-8c73-4942-9207-4bc6db824811_31153)