
Deskripsi
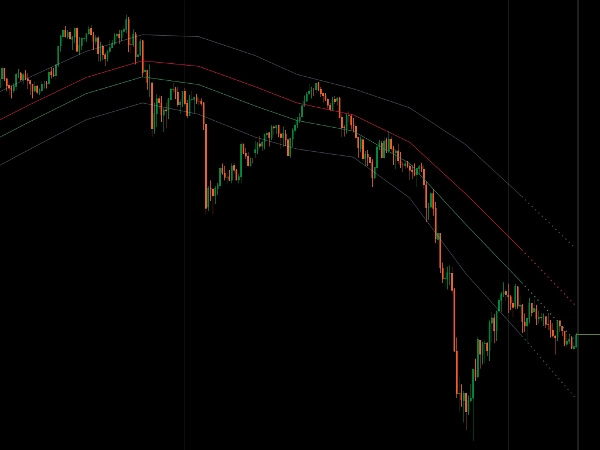
Saluran harga dinamis menggunakan rata-rata bergerak pada keempat harga OHLC untuk analisis struktur pasar yang lengkap.
Menerapkan jenis MA pilihan Anda (Simple, Exponential, Wilder, Deviation Scaled, SuperSmoother, Hull) pada batas High/Low, bias arah Open/Close, dan garis keseimbangan Median untuk visualisasi saluran yang kohesif.
Zona pembalikan Fibonacci bawaan (38,2%, 61,8%), lapisan pelicinan ganda untuk SMA/EMA yang menciptakan saluran ultra-bersih, tampilan multi-timeframe dengan mode tradisional stairstep atau garis tren diagonal, proyeksi berbasis momentum cerdas, dan deteksi penolakan batas memberikan struktur saluran yang komprehensif bagi trader yang menargetkan pembalikan rata-rata dan penilaian kekuatan tren di berbagai timeframe.
FITUR
Struktur Harga Lengkap
- High/Low mendefinisikan batas saluran
- Open/Close menunjukkan bias arah
- Garis Median: level 50% antara High/Low—pusat keseimbangan pasar yang sebenarnya
- Empat harga bekerja bersama untuk menunjukkan gambaran pasar yang lengkap
Zona Pembalikan Bawaan
- Level Fibonacci 38,2% dan 61,8% menandai area pullback yang signifikan secara statistik
- Zona dinamis yang beradaptasi dengan pergerakan harga
- Titik referensi masuk dan keluar yang jelas
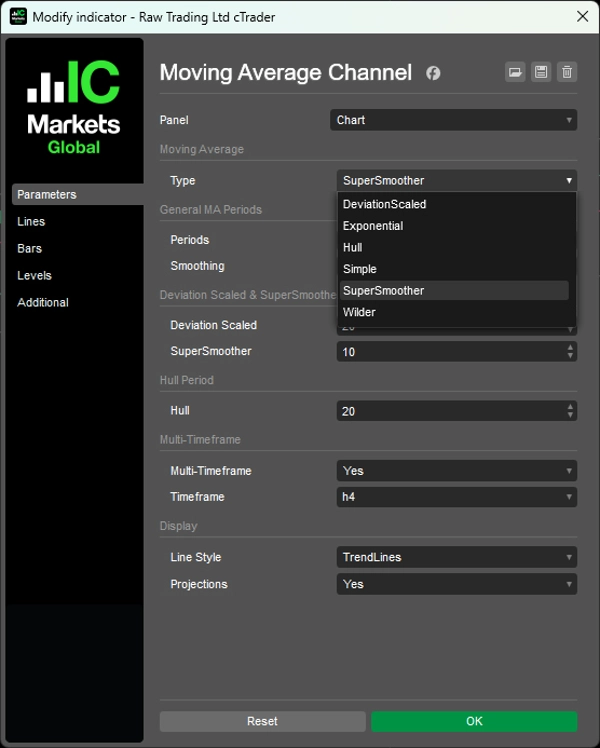
6 Jenis Rata-Rata Bergerak
- Simple, Exponential, Wilder, Deviation Scaled, SuperSmoother, Hull
- Pelicinan ganda untuk SMA/EMA: Periode + lapisan pelicinan tambahan untuk saluran ultra-bersih
- Algoritma canggih: Deviation Scaled beradaptasi dengan volatilitas, SuperSmoother menghilangkan lag, Hull menekankan aksi harga terbaru
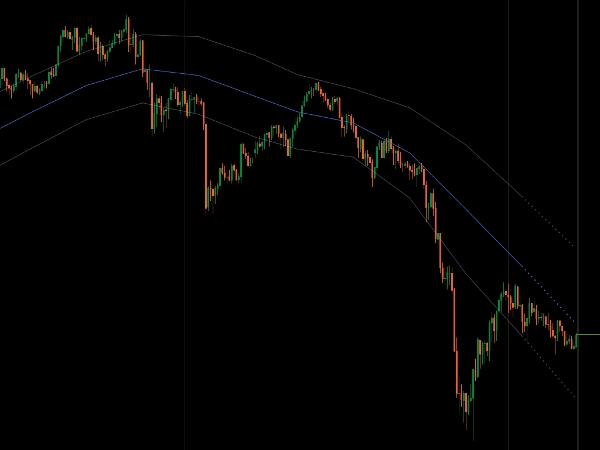
Multi-Timeframe dengan Garis Tren
- Lihat saluran timeframe lebih tinggi pada grafik timeframe lebih rendah
- Dua mode tampilan: garis stairstep tradisional atau garis tren diagonal (hanya MTF)
- Garis menghubungkan penutupan bar MTF untuk struktur diagonal yang bersih
- Proyeksi cerdas menunjukkan kemana saluran menuju berdasarkan momentum saat ini
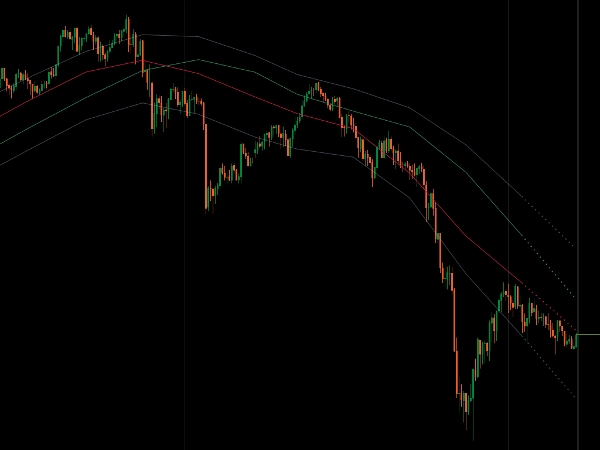
Sistem Visual Bersih
- Kemiringan saluran menunjukkan momentum
- Posisi harga menunjukkan kekuatan tren
- Penolakan batas menandakan potensi pembalikan
- Satu indikator untuk analisis struktur pasar yang lengkap
__________________________________________________________________________________________
INDIKATOR GRATIS LAINNYA
Jelajahi berbagai alat analisis pasar—dari struktur dan volume hingga regresi, volatilitas, dan timeframe kustom.
Kode sumber tersedia di repository GitHub.
Semua gratis untuk digunakan. Namun jika Anda ingin memberikan dukungan kopi, Anda dapat mengirimkannya di sini.
Support/Resistance
Volume
- Volume Activity Profiler
- Volume Efficiency Analyzer
- Volume Profile Analytics
- Volume Profile - Updated
- Volume Spread Analysis
- VWAP (Volume Weighted Average Price)
Rata-Rata Bergerak
- SSL Channel
- Anchored Moving Average
- Deviation-Scaled Moving Average
- Gann High Low Activator
- Instantaneous Trendline
- Kaufman Adaptive MA with Trend Vision
- Moving Average Channel
- Moving Averages Suite
- Trend Channel Moving Average
Utilitas/Kustom
Berbasis Regresi
Volatilitas
Osilator
__________________________________________________________________________________________
PENOLAKAN
Perdagangan melibatkan risiko. Indikator ini dimaksudkan hanya untuk analisis teknis — selalu terapkan manajemen risiko yang tepat dan berdaganglah dengan bertanggung jawab.
UMPAN BALIK & PENINGKATAN
Jika Anda memiliki saran, permintaan fitur, atau ide untuk peningkatan, silakan tinggalkan komentar di tab Diskusi. Umpan balik Anda membantu meningkatkan indikator untuk semua orang.
Ringkasan
The indicator incorporates built-in Fibonacci reversion zones at 38.2% and 61.8%, which dynamically adjust with price movement to highlight significant pullback areas and provide clear entry and exit reference points. It supports multi-timeframe analysis, allowing higher timeframe channels to be displayed on lower timeframe charts, with two visualization modes: traditional stairstep lines or diagonal trendlines connecting multi-timeframe bar closes. Smart momentum-based projections indicate potential channel direction, while boundary rejection detection signals possible reversals.
This tool offers a cohesive visual system where channel slope reflects momentum and price position indicates trend strength, enabling traders to assess trend direction, momentum shifts, and mean reversion zones across various markets including Forex, Indices, Commodities, Crypto, and Stocks.


