

Descrizione
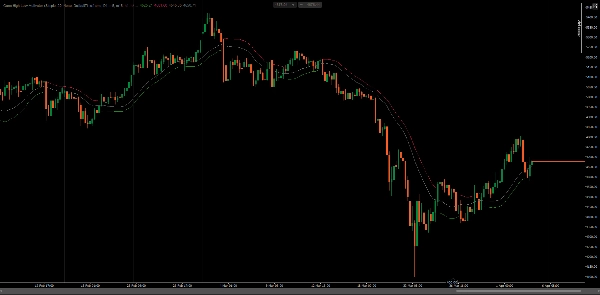
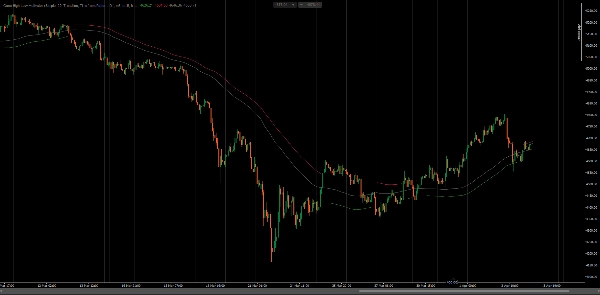
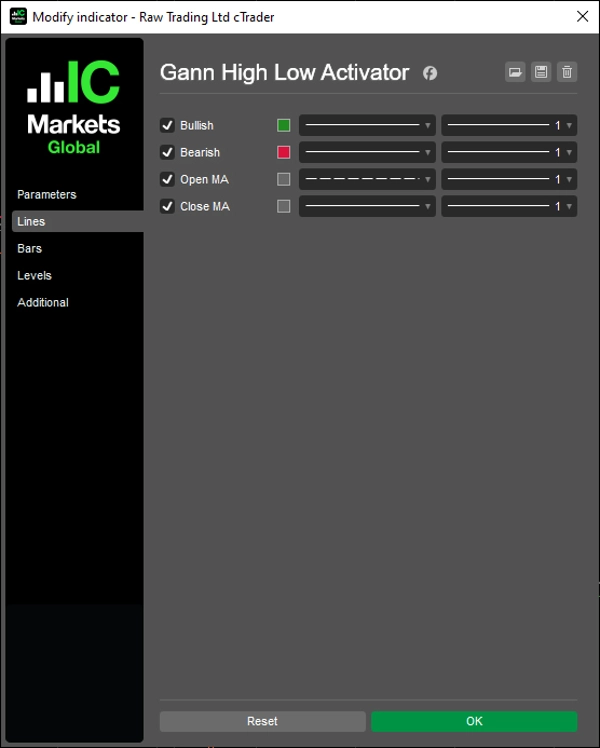
Attivazione della tendenza basata su MA con modalità multi-timeframe e proiezione della trendline.
Traccia la direzione del mercato confrontando il prezzo di chiusura con le medie mobili di High e Low su un periodo configurabile. Cambia stato quando la chiusura supera MA(High) in rialzo o scende sotto MA(Low) in ribasso — tracciando la banda opposta come livello attivo di supporto o resistenza.
Quattro modalità di calcolo (Nessuna, Interpolata, ScaledPeriod, Trendline), output MA di apertura e chiusura, risoluzione del pattern timeframe per la selezione automatica HTF, e proiezione della trendline per la stima della barra successiva offrono un quadro completo di trend-following per trader che lavorano su più timeframe e stili di analisi.
CARATTERISTICHE
Logica di Attivazione Principale
- Stato rialzista: attivato quando la chiusura supera MA(High) — traccia MA(Low) come supporto dinamico
- Stato ribassista: attivato quando la chiusura scende sotto MA(Low) — traccia MA(High) come resistenza dinamica
- Output MA di apertura e chiusura per ulteriore analisi di confluenza e sovrapposizione
- Supporta tutti i tipi di medie mobili di cTrader (SMA, EMA, DEMA, TEMA, WMA, ecc.)
Modalità Multi-Timeframe
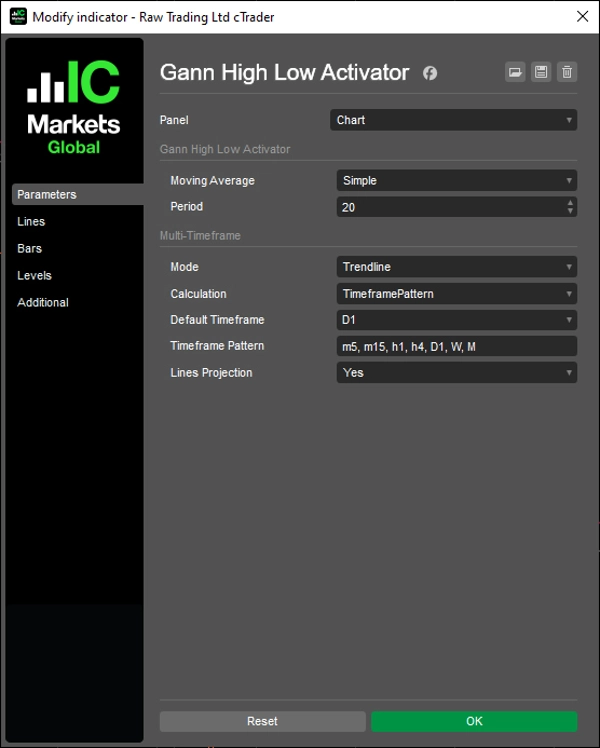
- Nessuna: calcolo standard a singolo timeframe sul grafico corrente
- Interpolata: valori HTF smussati mappati linearmente sulle barre LTF per sovrapposizione continua
- ScaledPeriod: scala il periodo in base al rapporto HTF-LTF — nessuna serie dati aggiuntiva richiesta
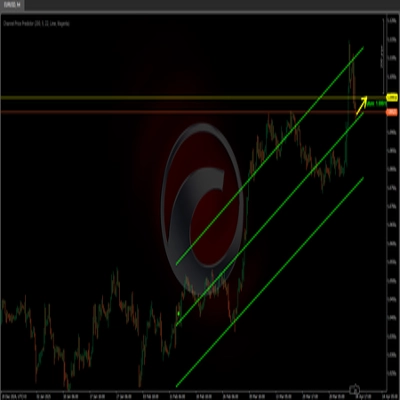
- Trendline: disegna oggetti trendline del grafico tra i confini delle barre HTF con controllo completo dello stile
Risoluzione del Timeframe
- DefaultTimeframe: seleziona manualmente qualsiasi HTF dal menu a discesa dei parametri
- TimeframePattern: seleziona automaticamente il timeframe superiore più vicino da una lista di token separati da virgola (es.
m5, m15, h1, h4, D1, W, M) - I token del pattern supportano minuti (m1–m45), ore (h1–h12), giorni (d1–d3), settimanali (W) e mensili (M)
Extra Modalità Trendline
- Controllo indipendente di colore, spessore e stile per ogni linea di output
- Il toggle di visibilità ricostruisce automaticamente tutti i segmenti — nessun oggetto obsoleto
- Il segmento di proiezione estende l'ultimo segmento HTF di una barra in avanti per anticipazione
Personalizzazione Completa
- Tipo e periodo MA configurabili
- Stile per linea di output ereditato dagli oggetti trendline in modalità Trendline
- Fallback pulito al timeframe corrente quando HTF ≤ timeframe del grafico
- Controllo della lunghezza delle linee per la gestione dell'intervallo di visualizzazione
- Pannello UI sul grafico per la regolazione dei parametri in tempo reale senza aprire le impostazioni
Lunghezza delle Linee
- Controlla quanto indietro vengono visualizzate le linee — da Hour8 a Year10
Si applica a tutte le modalità: output delle serie e oggetti trendline
Controlli UI
- Pannello combobox sul grafico per accesso rapido a Tipo MA, Modalità MTF, Calcolo, Timeframe e Lunghezza Linee
- Posizione configurabile: TopLeft, TopRight, BottomLeft, BottomRight o nascosta (Nessuna)
__________________________________________________________________________________________
ALTRI INDICATORI GRATUITI
Esplora un'ampia gamma di strumenti di analisi di mercato—dalla struttura e volume alla regressione, volatilità e timeframe personalizzati.
Il codice sorgente è disponibile nel repository GitHub repository.
Tutti gratuiti da usare. Ma se vuoi offrire un supporto per un caffè, puoi farlo qui.
Supporto/Resistenza
Volume
- Volume Activity Profiler
- Volume Efficiency Analyzer
- Volume Profile Analytics
- Volume Profile - Aggiornato
- Volume Spread Analysis
- VWAP (Prezzo Medio Ponderato per Volume)
Medie Mobili
- SSL Channel
- Anchored Moving Average
- Deviation-Scaled Moving Average
- Gann High Low Activator
- Instantaneous Trendline
- Kaufman Adaptive MA con Trend Vision
- Moving Average Channel
- Suite di Medie Mobili
- Trend Channel Moving Average
Utility/Personalizzati
Basato su Regressione
Volatilità
Oscillatori
__________________________________________________________________________________________
DICHIARAZIONE DI RESPONSABILITÀ
Il trading comporta rischi. Questo indicatore è destinato solo all'analisi tecnica — applica sempre una corretta gestione del rischio e opera responsabilmente.
FEEDBACK E MIGLIORAMENTI
Se hai suggerimenti, richieste di funzionalità o idee per miglioramenti, lascia un commento nella scheda Discussione. Il tuo feedback aiuta a migliorare l'indicatore per tutti.
Riepilogo
Key features include four multi-timeframe calculation modes—None (single timeframe), Interpolated (smoothed higher timeframe values), ScaledPeriod (period scaled by timeframe ratio), and Trendline (trendline objects between higher timeframe bars with style control). It supports all cTrader MA types (SMA, EMA, DEMA, TEMA, WMA, etc.) and offers Open and Close MA outputs for additional analysis.
Timeframe resolution options allow manual or automatic selection of higher timeframes based on customizable token patterns. Trendline mode provides independent styling and projects the trendline forward by one bar for anticipation. The indicator includes extensive customization for MA type, period, line styles, display length, and an on-chart UI panel for runtime parameter adjustments. It is suitable for traders applying trend-following techniques across multiple symbols and timeframes.
Discussioni
Recensioni dei clienti
Domande frequenti
Altro da questo autore














Prezzo