Açıklama
🚀 10.000+ tüccar zaten en iyi göstergelerimizi🏆 kullanıyor
Profesyonellerin neden bizi seçtiğini keşfedin – en güçlü araçlar cTrader’da (göstergeler, algoritmalar ve cBotlar) sizi bekliyor.
👉 Tüm en iyi sistemlerimizi buradan edinin:
_______________________________________________
📌 Piyasa Yapısı Göstergeleri
· ✅ AdvancedMarket Structure: Bos, Choch, SwinLevels, Order Blocks, Market Structure& Likidite Bulucu
· 🔄 Dinamik Piyasa Yapısı Dönüş Noktalarının Analizi
· 🧱 Order Block
· ⚖️ Piyasa Dengesizliği
· ⛓️ BOS & CHOCH
· 🧠 ICT Güç 3
_______________________________________________
🔚 Akıllı Çıkış Sistemleri
· 📍 Takip Eden Akıllı Algoritma
_______________________________________________
📐 ZigZag Göstergeleri
· 🔍 ZigZag Fiyat Likidite Projeksiyonu
· ➖ ZigZag
· 🎯 Zig-Zag Uç Nokta Takipçisi
_______________________________________________
🧱 Destek & Direnç Göstergeleri
· 🟩 SmartTrend Destek & Direnç Çizgileri
· 🧱 Tüm Destek ve Direnç Seviyeleri
_______________________________________________
📊 Trend & Kanal Göstergeleri
· 📊 Süpertrend
· 🧠 Uyarlanabilir Trend Kanalı
· 🔁 Reaktif Hareketli Ortalama
_______________________________________________
💧 Hacim & Likidite Araçları
· 🔍 Momentum Adil Değer Boşluğu
· 🕒 Adil Değer Boşluğu Seansları
_______________________________________________
⚡ Momentum & RSI Göstergeleri
· 🔎 Çok Katmanlı Mum Eğilimi
Takipçisi
_______________________________________________
🔮 Tahmin & Projeksiyon Araçları
· 📐 Linreg & ATR’ye Dayalı Tahmin
· 📏 Fibonacci Doğrusal Regresyon Çok Zamanlı
· 📈 Hacim Destekli Piyasa Akışı Projeksiyonu
______________________________________________________________________________________________
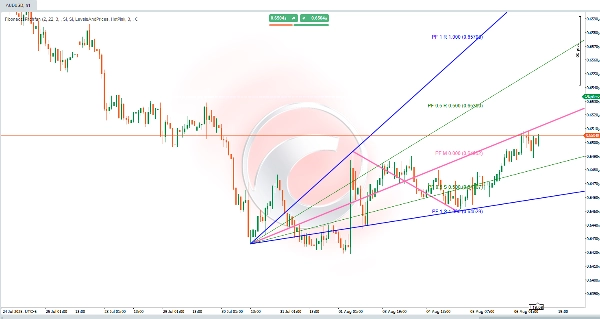
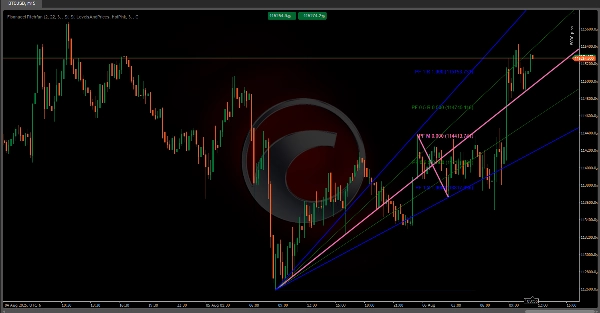
Fibonacci Pitchfan 📊✨
Bir gelişmiş teknik gösterge, pivot tespiti, dinamik trend çizgileri ve Fibonacci seviyelerini birleştirerek görsel bir araç oluşturur ve tüccarların trendleri, destek/direnç bölgelerini ve potansiyel dönüş noktalarını tanımlamasına yardımcı olur. 🎯 Yüksek derecede özelleştirilebilir olup, yapılandırılabilir parametreler aracılığıyla farklı ticaret stillerine uyum sağlar. Aşağıda mantığı ve hesaplamalarının bir dökümü bulunmaktadır.
Temel Bileşenler 🔧
Gösterge, birlikte çalışan üç ana unsur üzerine kuruludur:
1. Pivot Tespiti 🔄
- Anahtar fiyat dönüş noktalarını belirler (yüksek/düşük pivotlar).
- Bir kullanıcı tanımlı bar aralığı (pivot derinliği) kullanarak, bir barın çevresindeki barlara göre anlamlı bir yüksek/düşük olup olmadığını belirler.
- ATR tabanlı sapma eşiğini aşan pivotları zorunlu kılarak gürültüyü filtreler ve sadece ilgili fiyat dalgalanmalarını dikkate alır.
2. TrendFan & Fibonacci Seviyeleri 📐
- Tarihsel bir pivottan geleceğe doğru dinamik trend çizgileri yelpazesi projekte eder ve önceden tanımlanmış seviyeler (örneğin, 0.25, 0.5, 1.0) kullanarak potansiyel destek/direnç noktalarını işaretler.
- İsteğe bağlı Fibonacci seviyeleri (yatay çizgiler) ana pivotlar arasındaki düzeltme/uzatma noktalarını vurgular.
Hesaplama Mantığı 🧮
1. Pivot Tanımlama
- Her bar için algoritma, pivot derinliğine göre önceki/sonraki barların simetrik bir aralığını tarar.
- Bir yüksek pivot, barın en yüksek değeri aralıktaki en yüksekse onaylanır; bir düşük pivot ise en düşükse onaylanır.
- Sapma eşiği (fiyata göre ATR’nin %’si) küçük dalgalanmaları filtreler ve anlamlı piyasa hareketlerine odaklanır.
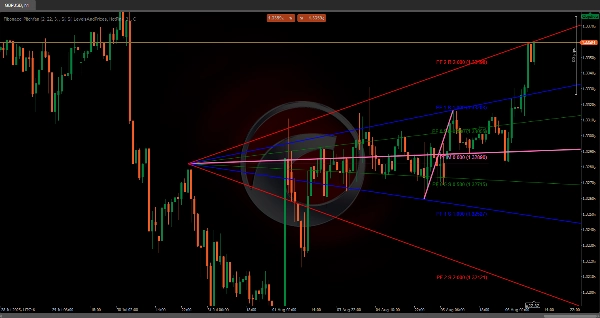
2. TrendFan Oluşumu 🌪️
- Bir referans tarihsel pivot (yapılandırılabilir) en son pivot ile eşleştirilerek bir temel çizgi oluşturulur.
- Aralarına bir orta çizgi çizilir ve önceden tanımlanmış seviyelerde projeksiyon trend çizgileri geleceğe doğru uzatılarak önemli fiyat bölgelerinden oluşan bir "yelpaze" oluşturulur.
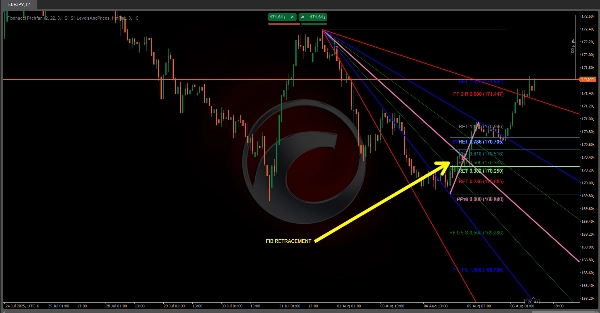
3. Fibonacci Projeksiyonları 🔢
- Düzeltme seviyeleri (örneğin, 0.236, 0.5, 0.618) önceki fiyat hareketi içinde potansiyel geri çekilme alanlarını işaretler.
- Uzatma seviyeleri, trend yönüne göre ayarlanmış olarak, fiyat hedeflerini ilk aralığın ötesine projekte eder.
- Seviyeler kullanıcı ayarlarına göre tersine çevrilebilir veya genişletilebilir.
Özelleştirilebilir Ayarlar ⚙️
- Sapma Eşiği: Fiyat hareketlerine duyarlılığı ayarlar (ATR tabanlı).
- Pivot Derinliği: Pivot tespiti için bar aralığını tanımlar (sinyal sıklığını etkiler).
- Tarihsel Referans: TrendFan için başlangıç pivotunun ne kadar geriye seçileceğini belirler.
- Görünürlük: TrendFan/Fibonacci görüntüsünü açar/kapatır ve gösterilecek belirli seviyeleri seçer.
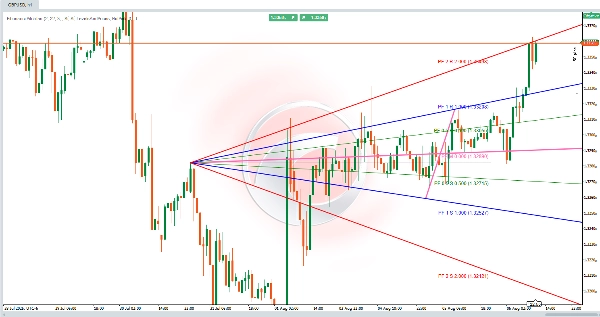
Sonuç 🏆
Fibonacci Pitchfan, piyasa yapısının net, dinamik bir görünümünü arayan tüccarlar için güçlü hepsi bir arada bir araçtır. Pivotları, trend çizgilerini ve Fibonacci seviyelerini birleştirerek, fiyat hareketlerini öngörmek ve bilinçli kararlar almak için uygulanabilir içgörüler sunar. 🚀
Özet
It generates a "TrendFan" by projecting dynamic trendlines from a configurable historical pivot to the latest pivot, creating a fan of key price zones. Optional Fibonacci retracement and extension levels highlight potential pullback areas and price targets, which can be customized or inverted according to user preferences.
Key customizable settings include deviation threshold sensitivity, pivot depth (bar range for pivot detection), historical reference for the initial pivot selection, and visibility options for TrendFan and Fibonacci levels. This tool is suitable for traders seeking actionable insights to anticipate price movements and make informed decisions based on a comprehensive view of market dynamics.