説明
🌟 **Zスコアとは?** 🌟
• **トレーディングにおけるZスコア**:これは現在の価格が最近の平均からどれだけ離れているかを標準偏差の単位で測る方法です。😊 値が0に近いほど価格は平均付近にあり、高い値(正または負)😮 は大きく乖離していることを示します。
• **統計的な有用性**:これらの値は価格が「買われ過ぎ」📈 または「売られ過ぎ」📉 の状況を特定するのに役立ち、平均回帰戦略や高ボラティリティの瞬間💥を検出するのに有用です。
🌟 **インジケーターの仕組み** 🌟
1. **平均と偏差の計算**:
- 過去の特定のバー(または期間)数を分析し、平均終値とその標準偏差を計算します。🧮
- これらの値を用いて、現在の価格が平均からどれだけ乖離しているかを決定します。この差はZスコアとして表されます。
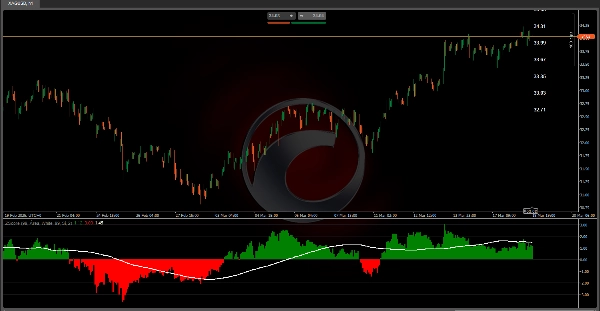
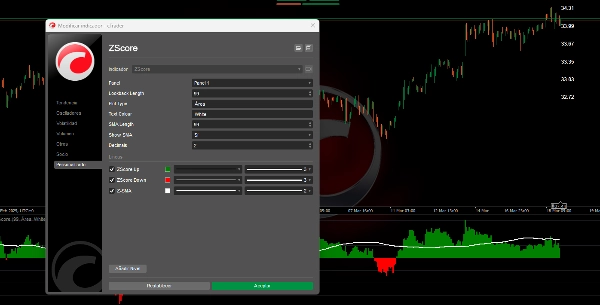
2. **Zスコアの視覚化**:
- **エリアモード**:2つのヒストグラムが表示されます。緑🟩は正の値(価格が平均より上)を、赤🔴は負の値(平均より下)を示します。これにより乖離の大きさと方向を視覚的に識別できます。
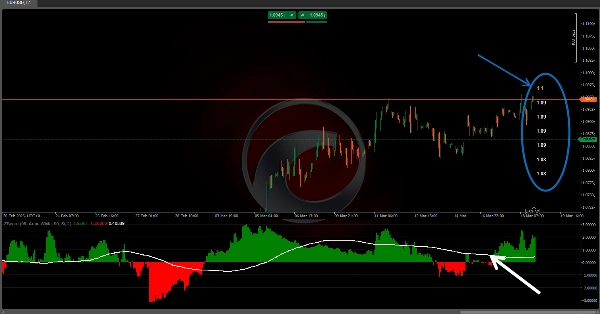
3. **Zスコアの移動平均**:
- Zスコアの値に対して移動平均を計算します。これにより変動が平滑化され、価格乖離の時間的な傾向を把握しやすくなります。📊
4. **確率ゾーンと参照ラベル**:
- さらに、チャート上に平均および各偏差レベルに対応する価格のラベルが配置されます。これは市場が価格的にどれほど「極端」に動いているかを理解するのに役立ちます。⚠️
---
🌟 **トレーダーのための解釈と応用** 🌟
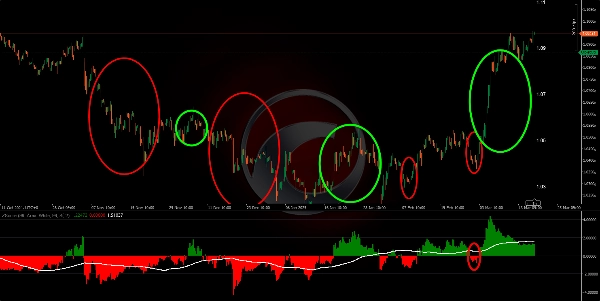
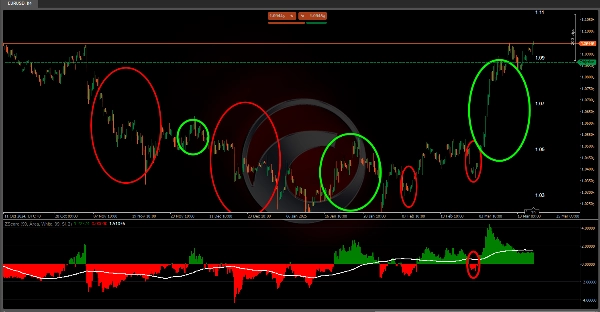
• **極端値の検出**:インジケーターの非常に高いまたは非常に低い値を観察することで、価格が平均から大きく離れていることをトレーダーは認識できます。これは修正が起こる可能性(平均回帰を期待する場合)🔄 や強いブレイクアウトが発生していることを示唆します。
• **トレンドの確認**:Zスコアの移動平均と関連バンドにより、価格乖離の傾向変化を確認できます。これらのラインのクロスや変化はエントリー🛡️やエグジットのシグナルとして解釈できます。
• **リスク管理**:偏差レベルや確率ゾーンを知ることで、ポジションサイズの調整やストップロス⬇️、テイクプロフィット⬆️のポイント設定が可能になります。通常の動きと極端な動きの基準があるためです。
• **市場の統計的理解**:単なるグラフィカルツールを超え、このインジケーターは市場行動を確率的に考えることを促します。動きの「正常性」を知ることは、取引機会を評価する際の決定的な要素となり得ます。🎯
🌟 **結論** 🌟
このアルゴリズムは価格データを統計的表現に変換し、価格が最近の動きに対してどれだけ乖離しているかを視覚化・定量化するのに役立ちます。Zスコア、移動平均、偏差バンド、確率表を組み合わせることで、複数の情報層を提供します。これにより、市場が異常な状態にある瞬間を特定しやすくなり、確率と統計に基づくエントリー🚀、エグジット🛑、リスク管理の意思決定を促進します。📈📉
Ctrader Store インジケーター:
Dynamic Market Structure
Analysis of Turning Points
Fibonacci Linear
Regression Multi-timeframe
Multi-Level Candle Bias
Tracker
Auto Support and
Resistance Trend Lines
概要
カスタマーレビュー
5 | 100 % | |
4 | 0 % | |
3 | 0 % | |
2 | 0 % | |
1 | 0 % |