
Penerangan
🚀 Lebih 10,000 pedagang sudah menggunakan penunjuk UTAMA kami 🏆
Temui mengapa profesional memilih kami – alat paling berkuasa di cTrader (penunjuk, algoritma, dan cBots) menanti anda.
👉 Dapatkan semua sistem UTAMA kami di sini:
📌 Penunjuk Struktur Pasaran
- ✅ Struktur Pasaran Lanjutan: Bos, Choch, SwinLevels, Order Blocks, Pencari Struktur Pasaran & Kecairan
- 🔄 Analisis Struktur Pasaran Dinamik bagi Titik Pusing
- 🧱 Order Block
- ⚖️ Ketidakseimbangan Pasaran
- ⛓️ BOS & CHOCH
- 🧠 Kuasa ICT 3
- 🌀 Zon Polariti Pasaran
🔚 Sistem Keluar Pintar
📐 Penunjuk ZigZag
🧱 Penunjuk Sokongan & Rintangan
📊 Penunjuk Trend & Saluran
- 🔄 Saluran Trend Auto
- 📊 Supertrend
- 🧠 Saluran Trend Adaptif
- 💥 Sistem Pecah Saluran
- 🌈 Gradient Trend Dinamik
- ⭐ SALURAN SSL PREMIUM
- 🔁 Purata Bergerak Reaktif
💧 Alat Isipadu & Kecairan
- 🔥 Peta Haba Volume POC
- 📉 Peta Likuidasi Leverage
- 🔍 Jurang Nilai Adil Momentum
- 🕒 Sesi Jurang Nilai Adil
⚡ Penunjuk Momentum & RSI
🔮 Alat Ramalan & Unjuran
- 📐 Ramalan Berdasarkan Linreg & ATR
- 📏 Regresi Linear Fibonacci Berbilang Jangka Masa
- 📈 Pemproyektor Aliran Pasaran Dikuasakan oleh Isipadu
Penganalisis Trend Momentum 🚀📊
Satu algoritma teknikal lanjutan yang direka untuk mengenal pasti arah trend pasaran dan menilai kekuatan, menggabungkan pelbagai metrik analitik. Penunjuk ini menggabungkan purata bergerak eksponen (EMA), kadar perubahan (RoC), volatiliti, kekuatan relatif, dan isipadu untuk memberikan isyarat yang jelas dan boleh diambil tindakan. Di bawah, kami menerangkan fungsi dan logik di sebalik pengiraannya.
Komponen Utama 🔧
Algoritma ini dibina atas lima elemen teras yang berfungsi secara sinergi:
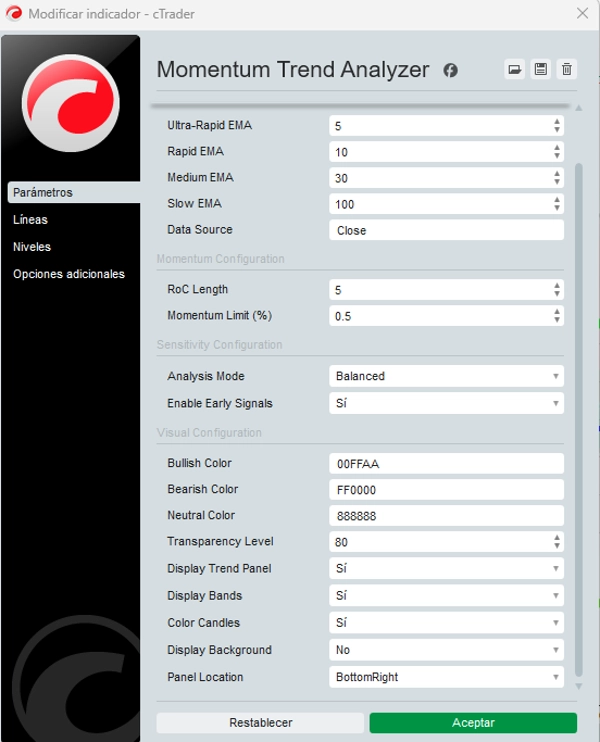
- Purata Bergerak Eksponen (EMA) 📈
-
- Menggunakan empat EMA dengan tempoh berbeza: ultra-pantas, pantas, sederhana, dan perlahan—biasanya dikira berdasarkan harga penutupan.
- EMA jangka pendek (ultra-pantas & pantas) mengesan pergerakan segera, manakala EMA jangka panjang (sederhana & perlahan) mencerminkan trend berterusan.
- Kadar Perubahan (RoC) ⚡
-
- Mengukur perubahan harga peratusan dalam tempoh tertentu, berfungsi sebagai penunjuk momentum langsung.
- Satu RoC yang dilicinkan menapis turun naik kecil dan menstabilkan isyarat.
- Julat Benar Purata Dinormalisasi (ATR) 🌪️
-
- ATR mengukur volatiliti sejarah, dinormalisasi dengan membahagikannya dengan harga semasa untuk penilaian relatif.
- ATR dinormalisasi tinggi menandakan peningkatan volatiliti, mempengaruhi tafsiran kekuatan trend.
- Indeks Kekuatan Relatif (RSI) 💪
-
- Osilator ini mengukur besaran dan kelajuan pergerakan harga, mengenal pasti keadaan terlebih beli/terlebih jual.
- Membantu menilai intensiti momentum dalam trend.
- Isipadu Purata 🔊
-
- Purata bergerak mudah isipadu dagangan mengesan tempoh aktiviti tinggi, mengukuhkan kesahihan isyarat.
Logik Pengiraan 🧠
Penganalisis Trend Momentum menghasilkan isyarat trend dan kekuatan melalui gabungan syarat dan pengiraan tertentu:
1. Penentuan Trend
- 🟢 Trend Bullish: Disahkan apabila EMA pantas > EMA sederhana, EMA sederhana > EMA perlahan, dan harga penutupan > EMA pantas.
- 🔴 Trend Bearish: Disahkan apabila EMA pantas < EMA sederhana, EMA sederhana < EMA perlahan, dan harga penutupan < EMA pantas.
- ⚪ Trend Neutral: Berlaku apabila tiada syarat dipenuhi, menunjukkan pengukuhan atau ketidaktentuan.
2. Isyarat Awal Trend 🔍
- Mengesan potensi perubahan trend sebelum pengesahan penuh menggunakan:
-
- EMA ultra-pantas
- Cerun EMA pantas
- RoC yang dilicinkan
- Contoh: Satu isyarat bullish awal dicetuskan jika EMA ultra-pantas melintasi di atas EMA pantas, cerun EMA pantas positif, dan RoC yang dilicinkan melebihi ambang momentum.
3. Pelarasan Sensitiviti ⚖️
Tiga mod tersedia:
- 🛡️ Konservatif: Mengutamakan isyarat yang disahkan, meminimumkan positif palsu (pengesanan lebih lambat).
- ⚔️ Agresif: Mengutamakan isyarat awal untuk tindak balas lebih pantas (risiko lebih tinggi).
- ⚖️ Seimbang: Pendekatan pertengahan.
4. Pengiraan Kekuatan Trend 💯
Kekuatan diperoleh daripada integrasi berwajaran daripada:
- Sebaran EMA: Jarak (%) antara EMA pantas dan perlahan.
- Sumbangan RSI: Perbezaan antara RSI dan 50 (bullish/bearish).
- Volatiliti (ATR Dinormalisasi): Melaraskan kekuatan berdasarkan turun naik pasaran.
- Isipadu Relatif: Kekuatan meningkat jika isipadu semasa > purata.
- Momentum (RoC yang Dilicinkan): Mengukur kelajuan pergerakan.
- Hasil: Satu peratusan kekuatan (0%-100%)—nilai lebih tinggi = trend kukuh.
5. Jalur Dinamik 🎯
- Tiga jalur atas/bawah berdasarkan harga tinggi/rendah terkini.
- Bertindak sebagai tahap sokongan/rintangan dinamik yang menyesuaikan dengan volatiliti pasaran.
Aplikasi Praktikal untuk Pedagang 💼
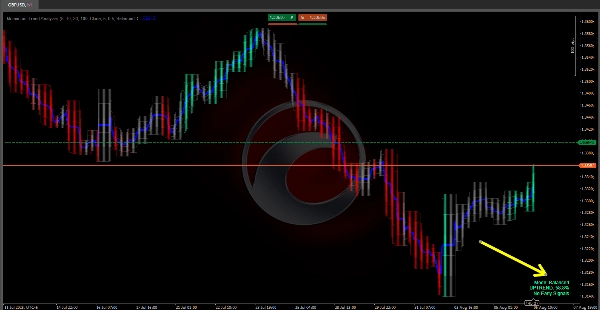
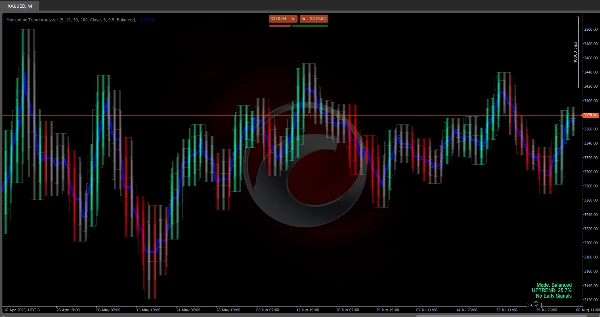
- 📊 Visualisasi: Trend dipaparkan melalui bayangan berwarna (🟢 bullish, 🔴 bearish, ⚪ neutral) + garis trend.
- 💪 Kekuatan: Nilai peratusan (contoh, 24.3% = berhati-hati; >50% = keyakinan tinggi).
- 🔄 Strategi Jalur:
-
- Bullish: Beli di jalur bawah, jual di jalur atas.
- Bearish: Jual di jalur atas, tutup di jalur bawah.
- 🚨 Isyarat Awal: Membantu pedagang agresif menjangka pasaran yang bergerak pantas.
- 🛠️ Fleksibiliti: Mod sensitiviti menyesuaikan dengan konservatif (tunggu pengesahan) atau agresif (bertindak awal) gaya.
Kesimpulan 🎯
Penganalisis Trend Momentum menyediakan analisis trend dan momentum yang menyeluruh dengan menggabungkan EMA, RoC, ATR dinormalisasi, RSI, dan isipadu. Logik pengiraannya—berdasarkan syarat jelas dan faktor berwajaran—menyesuaikan dengan tahap risiko dan strategi dagangan yang berbeza, menjadikannya alat yang berkuasa untuk pedagang..
Ringkasan
The indicator determines bullish, bearish, or neutral trends based on EMA relationships and price positioning. It provides early trend shift signals using ultra-fast EMA, fast EMA slope, and smoothed RoC. Users can select from three sensitivity modes—conservative, balanced, and aggressive—to adjust signal responsiveness according to their trading style.
Trend strength is calculated as a weighted integration of EMA spread, RSI deviation from neutral, normalized volatility, relative volume, and momentum, expressed as a percentage from 0% to 100%. The indicator also features dynamic bands derived from recent price highs and lows, serving as adaptive support and resistance levels.
Visualization includes colored shading to indicate trend direction and a trendline, with strength values aiding decision-making. The band strategy suggests buying near lower bands and selling near upper bands in bullish trends, and the reverse in bearish trends. This tool supports diverse risk levels and trading strategies by providing comprehensive trend and momentum analysis.


![Logo "Smart Money Concepts (SMC) [Iridio Capital]"](https://cdn.ctrader.com/image/webp/28b69fd1-ef54-4bed-9487-07e78e883be4_40934)


