
Penerangan
🚀 Lebih 10,000 pedagang sudah menggunakan penunjuk TERBAIK kami🏆
Temui mengapa profesional memilih kami – alat paling berkuasa di cTrader (penunjuk, algoritma, dan cBots) menanti anda.
👉 Dapatkan semua sistem TERBAIK kami di sini:
_______________________________________________
_______________________________________________
📌 Penunjuk Struktur Pasaran
· ✅ AdvancedMarket Structure: Bos, Choch, SwinLevels, Order Blocks, Market Structure& Liquidity Finder
· 🔄 Dynamic Market StructureAnalysis of Turning Points
· 🧱 Order Block
· ⚖️ Market Imbalance
· ⛓️ BOS & CHOCH
· 🧠 ICT Power of 3
______________________________________________________________-
Simpan cBots : 🧠 Gold & BTC BreakoutSession Pivots 🧠
_______________________________________________
🔚 Sistem Keluar Pintar
_______________________________________________
📐 Penunjuk ZigZag
· 🔍 ZigZag Price LiquidityProjection
· ➖ ZigZag
· 🎯 Penjejak Extremity Zig-Zag
_______________________________________________
🧱 Penunjuk Sokongan & Rintangan
· 🟩 SmartTrend Support &Resistance Lines
· 🧱 Semua Tahap Sokongan dan Rintangan
_______________________________________________
📊 Penunjuk Trend & Saluran
· 📊 Supertrend
_______________________________________________
💧 Alat Isipadu & Kecairan
_______________________________________________
⚡ Penunjuk Momentum & RSI
· 🔎 Multi-Level Candle BiasTracker
_______________________________________________
🔮 Alat Ramalan & Unjuran
· 📐 Ramalan Berdasarkan Linreg& ATR
· 📏 Regresi Linear FibonacciMulti-timeframe
· 📈 Pemproyektor Aliran Pasaran Berkuasa Isipadu
_________________________________________________________________________________
_________________________________________________________________________________
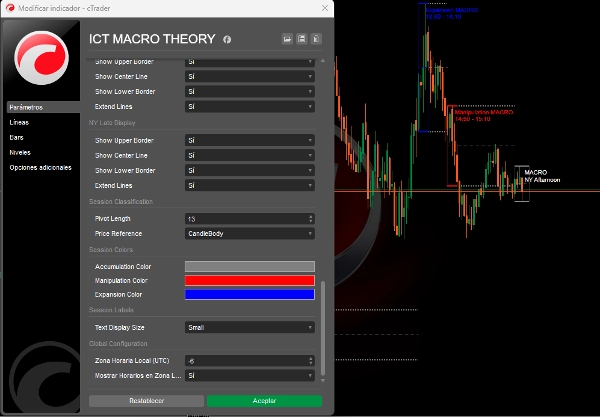
🌐 TEORI MAKRO ICT
⚠️ NOTA PENTING: Penunjuk ini hanya berfungsi pada jangka masa di bawah 5 minit.
Penjelasan Tempoh Makro ICT
Tempoh makro ICT adalah selang masa pendek di mana algoritma mencari kecairan atau melaraskan harga untuk jurang nilai adil. Asas makro ICT ini terletak pada teori masa dan harga ICT.
Makro adalah "satu siri arahan pendek yang mencipta satu peristiwa dalam penghantaran harga", seperti yang ditakrifkan oleh ICT sendiri.
Makro ICT bukan strategi dagangan lengkap, tetapi boleh menambah kesesuaian pada dagangan anda dan memaksimumkan keuntungan. Ia berlaku semasa sesi London, New York, tengah hari, dan petang.
🔮 Pelaksanaan Lanjutan Teori Masa Makro ICT:
Sambungan Langsung ke Konsep ICT:
Kod melaksanakan tepat 3 jenis makro ICT yang diterangkan dalam teori, menggunakan logik pengelasan berdasarkan:
- Analisis Struktur Pasaran:
-
- Pengesanan Sesi Makro
- Merekod masa ICT tepat (London 02:33, NY 09:50, dll.).
- Mengesan perubahan struktur sebelum dan semasa setiap sesi makro.
- Secara automatik mengelas kepada:
-
- 🟥 Manipulasi: Apabila harga menyapu kecairan di kedua-dua sisi (beli/jual).
- 🟦 Pengembangan: Pergerakan berarah mengambil kecairan di satu sisi (selari dengan trend).
- 🟩 Pengumpulan: Julat ketat di mana harga "mengumpul" kecairan.
- Tahap Utama Diperluas:
-
- Melukis tinggi/rendah setiap sesi makro.
- Mengira dan melanjutkan harga purata (titik tengah) ke sesi seterusnya.
- Tahap ini bertindak sebagai sokongan/rintangan dinamik (Penting dalam ICT!).
- Pengesanan Kecairan Masa Nyata:
-
- Menggunakan data 1 minit untuk mengenal pasti pivot tepat (sama seperti yang dilihat pada jangka masa lebih rendah).
Penambahbaikan & Kemas Kini Akan Datang:
- Pengesanan Sapu Kecairan: Akan mengenal pasti sapuan kecairan sebelumnya (tinggi/rendah hari/minggu sebelumnya).
- Jurang Nilai Adil (FVG): Akan mengesan dan memvisualisasikan jurang nilai adil.
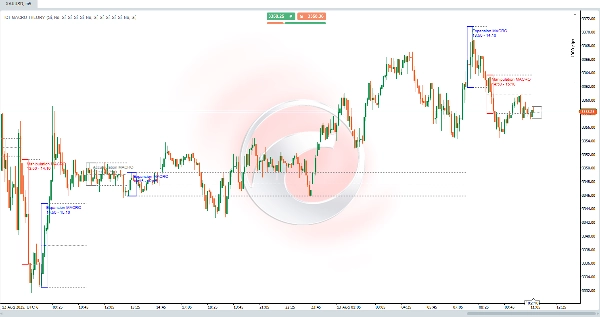
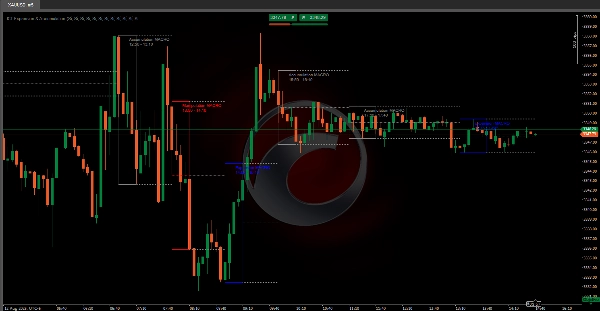
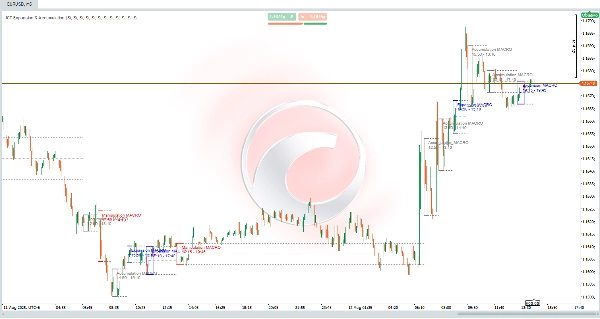
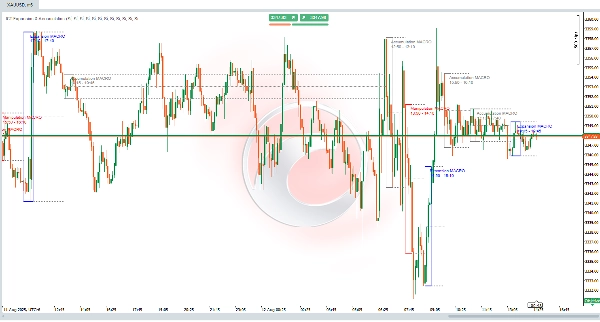
📊 Contoh Praktikal ICT
Senario Pembukaan NY (09:50-10:10):
- Pra-sesi: Harga menyapu kecairan sisi beli (rendah tempatan).
- Semasa sesi:
-
- Dikelaskan sebagai 🟥 MANIPULASI.
- Harga beralih ke struktur bearish.
- Pasca-sesi:
-
- Garis lanjutan menandakan rintangan pada tinggi sesi.
- Penolakan dagangan di zon dengan RR 1:3.
✅ Setia kepada Prinsip ICT:
"Makro bukan strategi lengkap tetapi menambah kesesuaian dengan mengenal pasti di mana algoritma akan mencari kecairan."
Ringkasan
The indicator analyzes market structure and detects key macro sessions—London, New York, midday, and afternoon—recording exact ICT times. It classifies price behavior into three types of macros: Manipulation (price sweeps liquidity on both sides), Expansion (directional movement aligned with trend), and Accumulation (tight range where price accumulates liquidity). It also draws and extends session highs, lows, and average price levels to act as dynamic support and resistance.
Using 1-minute data, ICT MACRO THEORY detects precise pivots for real-time liquidity identification. While not a complete trading strategy, it adds confluence to trades by highlighting where algorithms seek liquidity. Planned updates include detection of liquidity sweeps and visualization of fair value gaps.
This tool is intended for traders seeking to incorporate ICT macro time concepts into their analysis for enhanced market structure insight and liquidity detection on very short timeframes.


