
Penerangan
Kunci pengiraan purata bergerak pada mana-mana saat pasaran dan jejak tingkah laku harga semasa ia melanjut ke hadapan.
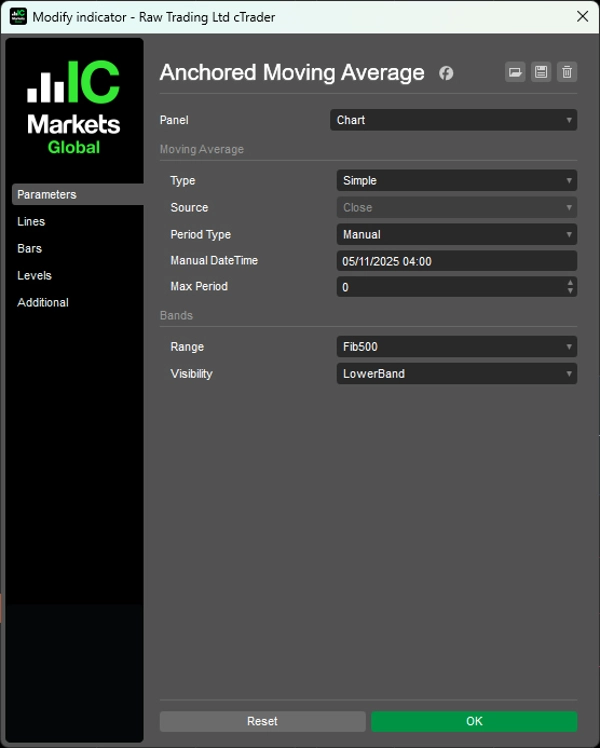
Pin pengiraan pada titik permulaan pilihan anda (tarikh dan masa manual atau tempoh semakan dari 1 jam hingga 10 tahun), kemudian berkembang secara semula jadi dengan jalur Fibonacci adaptif berdasarkan julat harga sebenar.
Lapan tahap Fibonacci (11.4% hingga 100%) yang menyesuaikan dengan pergerakan harga sebenar, zon pembalikan min terbina dalam 38.2%-62.8%, dua jenis MA (SMA/EMA), pelbagai mod paparan (jalur penuh, sempadan ekstrem sahaja, zon pembalikan sahaja), dan had tempoh maksimum untuk jangka masa panjang memberikan penjejakan momentum berasaskan acara untuk pedagang yang menyasarkan penarikan balik dari titik ayunan penting dan analisis tingkah laku harga selepas acara.
CIRI-CIRI
Pengiraan Berjangka Masa
- Berbeza dengan MA standard yang menggunakan tempoh tetap, ini berkembang secara semula jadi dari titik permulaan pilihan anda
- Penambatan fleksibel: Tetapkan tarikh dan masa manual atau gunakan tempoh semakan yang telah ditetapkan (1 jam hingga 10 tahun)
- Jejak momentum dari saat pasaran yang penting
- Titik penambatan konsisten merentas pelbagai jangka masa
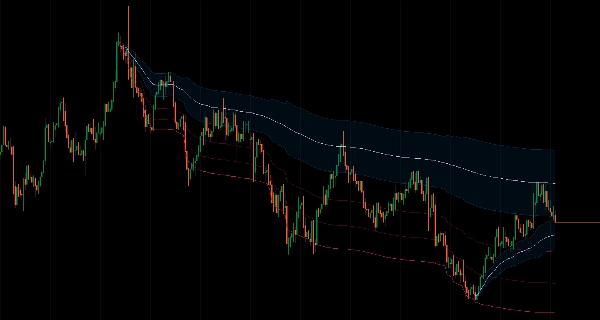
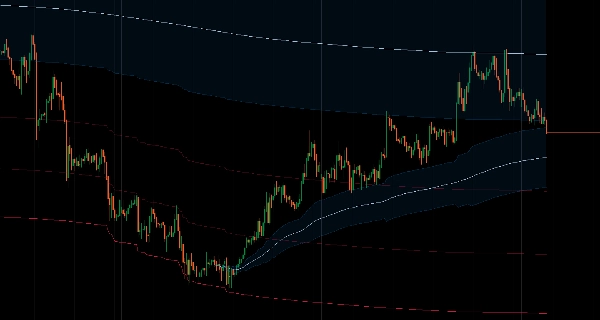
Jalur Fibonacci Adaptif
- Jalur dikira secara automatik berdasarkan julat harga sebenar, bukan gandaan ATR sewenang-wenangnya
- 8 tahap Fibonacci (11.4% hingga 100%) yang menyesuaikan dengan pergerakan harga sebenar
- Zon pembalikan min: Zon pembalikan 38.2%-62.8% terbina dalam untuk kawasan kemasukan berkemungkinan tinggi
- Zon kebarangkalian yang ditakrifkan secara matematik
Dua Jenis MA
- Purata Bergerak Mudah
- Purata Bergerak Eksponen
- Had tempoh maksimum: Mencegah penghalusan berlebihan pada jangka masa panjang
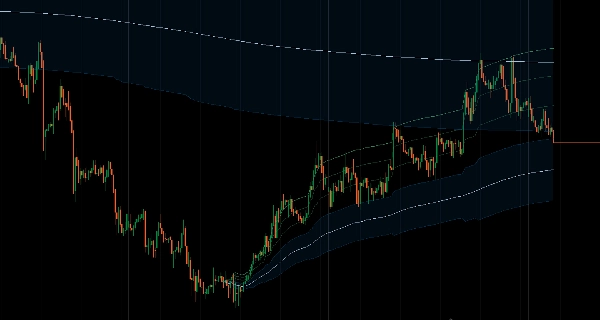
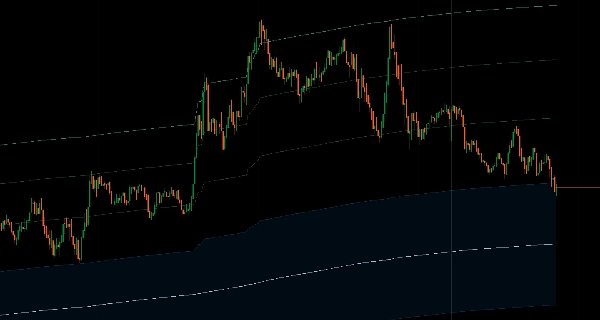
Pelbagai Mod Paparan
- Jalur penuh: Semua tahap Fibonacci kelihatan
- Atas/bawah sahaja: Papar sempadan ekstrem
- Zon pembalikan sahaja: Fokus pada kawasan pembalikan min
- Reka bentuk bersih dan bertujuan tanpa kekacauan
Analisis Berasaskan Acara
- Lihat bagaimana harga semasa berkaitan dengan pergerakan dari tahap penting
- Jejak tingkah laku harga selepas acara
- Kemasukan berasaskan struktur dengan titik rujukan yang jelas
__________________________________________________________________________________________
LAGI PENUNJUK PERCUMA
Terokai pelbagai alat analisis pasaran—daripada struktur dan volum kepada regresi, volatiliti, dan jangka masa tersuai.
Kod sumber tersedia di repositori GitHub repository.
Semua percuma untuk digunakan. Tetapi jika anda ingin menyokong dengan kopi, anda boleh salurkan ia di sini.
Sokongan/Perlawanan
Volum
- Profiler Aktiviti Volum
- Penganalisis Kecekapan Volum
- Analitik Profil Volum
- Profil Volum - Dikemas Kini
- Analisis Sebaran Volum
- VWAP (Harga Purata Berwajaran Volum)
Purata Bergerak
- Saluran SSL
- Purata Bergerak Berjangka
- Purata Bergerak Skala Deviasi
- Pengaktif Tinggi Rendah Gann
- Garis Tren Segera
- MA Adaptif Kaufman dengan Visi Tren
- Saluran Purata Bergerak
- Set Purata Bergerak
- Purata Bergerak Saluran Tren
Utiliti/Tersuai
Berasaskan Regresi
Volatiliti
Pengayun
__________________________________________________________________________________________
PENAFIAN
Perdagangan melibatkan risiko. Penunjuk ini hanya untuk analisis teknikal — sentiasa gunakan pengurusan risiko yang betul dan berdagang dengan bertanggungjawab.
MAKLUMBALAS & PENAMBAHBAIKAN
Jika anda mempunyai cadangan, permintaan ciri, atau idea untuk penambahbaikan, sila tinggalkan komen di tab Perbincangan. Maklum balas anda membantu meningkatkan penunjuk untuk semua orang.
Ringkasan
The indicator features adaptive Fibonacci bands calculated based on the actual price range, not arbitrary multiples. It includes eight Fibonacci levels from 11.4% to 100%, with a built-in mean reversion zone between 38.2% and 62.8%, providing mathematically defined probability zones for potential entry areas. Multiple display modes are available, including full bands, extreme boundaries only, or reversion zone only, designed for a clean and purposeful chart presentation.
This tool facilitates analysis of price behavior relative to significant swing points or events, supporting structured entries and post-event price tracking. It is intended for technical analysis and includes a disclaimer advising responsible trading with proper risk management.
Ulasan pelanggan
5 | 100 % | |
4 | 0 % | |
3 | 0 % | |
2 | 0 % | |
1 | 0 % |


