
Descripción
Indicadores de Pinescriptlabs Store: 🤖Pinescriptlabs Store cBots:
SmartTrend Support &
Resistance Lines Gold & BTC BreakoutSession Pivots(nuevo)YieldShield" 🛡️
Dynamic Market Structure
Análisis de Puntos de Giro
Fibonacci Linear
Regresión Multitemporal
Multi-Level Candle Bias
Tracker
Auto Support and
Resistance Trend Lines
All Support and
Resistance Levels
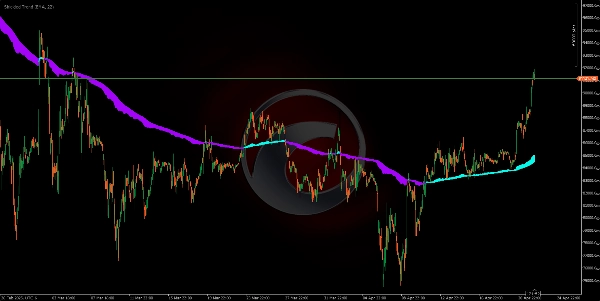
El ShieldedTrend indicador se basa en una combinación inteligente de dos metodologías de trading ampliamente utilizadas: velas Heikin-Ashi 📊 y medias móviles exponenciales (EMA) 📈. Aquí está la lógica paso a paso:
1️⃣ Base: Velas Heikin-Ashi Modificadas
Las velas Heikin-Ashi son una versión suavizada de las velas tradicionales, diseñadas para filtrar el ruido del mercado. Su cálculo original usa promedios de precios, pero ShieldedTrend las modifica de dos maneras clave:
- Cierre Heikin-Ashi:
Calculado como el promedio de los 4 precios principales de la vela real:
(Apertura + Máximo + Mínimo + Cierre) / 4 🔄. - Apertura Heikin-Ashi:
No se toma directamente del precio real, sino del promedio de la apertura y cierre de la vela Heikin-Ashi anterior.
Esto crea un efecto natural de "suavizado" que elimina fluctuaciones bruscas, haciendo las tendencias más claras.
2️⃣ Suavizado con EMA
ShieldedTrend aplica una media móvil exponencial (EMA) a ambos componentes de las velas Heikin-Ashi:
- Línea de Apertura Suavizada:
La EMA aplicada a la apertura Heikin-Ashi. - Línea de Cierre Suavizada:
La EMA aplicada al cierre Heikin-Ashi.
La EMA da más peso a los datos recientes, permitiendo que el indicador reaccione rápidamente a los cambios de tendencia mientras mantiene la suavidad.
3️⃣ La "Zona de Protección" (Escudo) 🛡️
El área coloreada entre las dos líneas (apertura y cierre suavizados) actúa como una zona de amortiguación o confirmación:
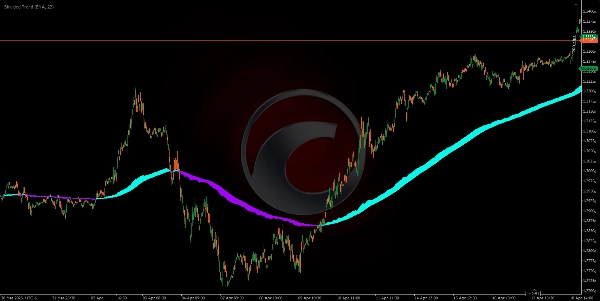
- Ancho de la Zona:
Depende de la diferencia entre las dos líneas. -
- Área amplia = Tendencia fuerte (las líneas están separadas) 💪.
- Área estrecha = Indecisión o tendencia débil 🤔.
4️⃣ Lógica de Trading Integrada
- Señal de Tendencia:
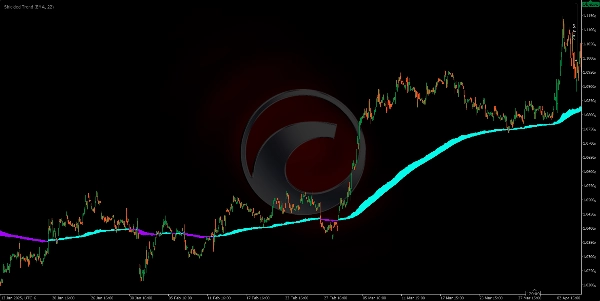
Un cambio de color indica una posible reversión (por ejemplo, cian a púrpura = posible inicio de una tendencia bajista) 🔵🟣. - Fuerza de la Tendencia:
El ancho del área coloreada actúa como un filtro de confianza: -
- Solo operar si el área es lo suficientemente amplia (evita mercados volátiles) ✅.
- Protección Contra Movimientos Falsos:
Si el área se estrecha repentinamente, sugiere que la tendencia actual puede estar perdiendo impulso—aunque el color aún no haya cambiado ⚠.
🌟 ¿Por Qué Funciona?
- Heikin-Ashi + EMA: Suaviza el precio dos veces (velas + media móvil), filtrando el 90% del ruido 🎯.
- Zona de Protección: Evita operar en mercados poco claros, reduciendo operaciones fallidas 📉➡️📈.
- Enfoque Visual: La combinación de color y área facilita incluso a traders principiantes identificar patrones rápidamente ⚡.
Resumen
The indicator applies EMA smoothing to both the Heikin-Ashi open and close lines, enabling quick reaction to trend changes while maintaining smoothness. The area between these two smoothed lines forms a "Protection Zone" or shield, which acts as a buffer and confirmation zone. The width of this zone indicates trend strength: a wide zone signals a strong trend, while a narrow zone suggests indecision or a weak trend.
ShieldedTrend’s integrated trading logic uses color changes to signal potential trend reversals and the zone width as a confidence filter to avoid trading in choppy markets. The indicator helps protect against false moves by signaling when trend momentum is weakening even before a color change occurs. Its visual design facilitates quick pattern recognition, making it accessible for traders of all experience levels.


