Описание
Индикаторы Pinescriptlabs Store: Pinescriptlabs Store cBots : (cBot) Gold & BTC BreakoutSession Pivots(новый)
Проекция ликвидности цены ZigZag
Умный алгоритм трейлинга (новый)
Карта ликвидации с кредитным плечом
Прогноз на основе Linreg & ATR
SmartTrend Поддержка &
Сопротивление
Линии
Сессии справедливого ценового разрыва
Динамический
Анализ рыночной структуры
Поворотных
Точек
Points
Фибоначчи
Линейная
Регрессия
Мультивременной
Импульсный справедливый ценовой разрыв
Многоуровневый
Трекер смещения свечей
Tracker
Авто
Поддержка и
Сопротивление
Тренд
Линии
Все
Уровни поддержки и
Сопротивления
Уровни
Динамический диапазон импульса
📊 Прогноз рыночного потока:
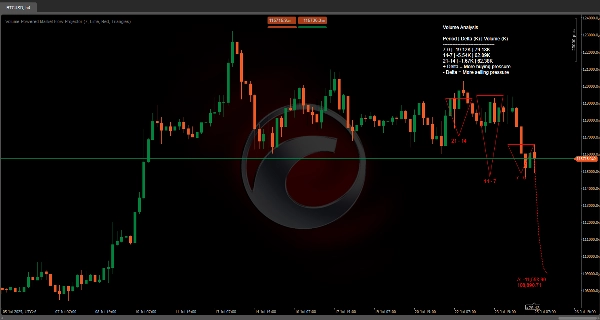
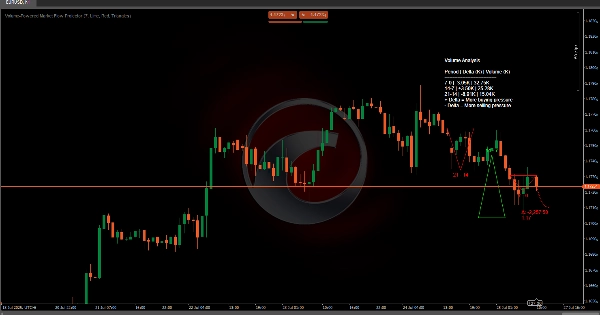
Индикатор FutureTrend предназначен для динамического анализа и прогнозирования поведения рынка путем интеграции данных о цене и объеме по нескольким временным измерениям. Его ключевые функции включают:
⏳ Анализ трех периодов
📈 Вычисляет средние цены (максимумы и минимумы) и дельту объема (разницу между покупательским и продавательским давлением) за три последовательных периода, определенных параметром Period.
🔍 Этот консолидированный обзор исторических движений помогает выявить доминирующие тренды и изменения в поведении рынка.
🚀 Проекция будущей трендовой линии
📊 Используя взвешенное среднее дельты объемов за три проанализированных периода, индикатор проецирует будущую трендовую линию, отражающую возможное направление рынка.
🛠️ Проекция динамически корректируется с использованием сглаживающих факторов, чтобы избежать экстремальных прогнозов.
🔷 Визуальное представление форм
🎨 Исторические данные визуально представлены с помощью геометрических фигур (треугольники, круги или квадраты), которые иллюстрируют эволюцию объема и ценовых диапазонов для каждого периода.
🔴🟢 Назначенные цвета (UpColor и DownColor) указывают на преобладающий тренд (бычий или медвежий), что позволяет быстро интерпретировать данные.
🏷️ Средний дельта объем и метка будущей цены
📍 В конце проецируемой трендовой линии метка отображает средний дельта объем и оценочную будущую цену, предоставляя ключевую ссылку для потенциальных движений цены и силы тренда.
📋 Таблица данных объема
📑 Предоставляет подробную таблицу с разбивкой общих объемов и дельта-разниц за три проанализированных периода.
📊 Это позволяет трейдерам быстро сравнивать данные объема, интерпретировать рыночный контекст и поддерживать прогноз будущего тренда.
🔮 Направление
Объединяя объем и ценовые данные, индикатор предлагает надежный инструмент для прогнозирования как силы тренда, так и потенциальных изменений в поведении рынка в предстоящие периоды.
Сводка
The indicator projects a future trendline based on a weighted average of delta volumes from the analyzed periods, dynamically adjusted with smoothing factors to prevent extreme predictions. Historical data is visually represented using geometric shapes—such as triangles, circles, or boxes—that illustrate volume and price range evolution for each period. Colors indicate prevailing trends, with distinct hues for bullish and bearish conditions.
At the end of the projected trendline, a label displays the average delta volume and estimated future price, providing a reference for potential price movements and trend strength. Additionally, a detailed volume data table breaks down total volumes and delta differences for the three periods, supporting market context interpretation and trend projection. By combining volume and price data, this tool aids in predicting trend strength and potential market behavior shifts.
Отзывы покупателей
5 | 100 % | |
4 | 0 % | |
3 | 0 % | |
2 | 0 % | |
1 | 0 % |