Descrição
🚀 Mais de 10.000 traders já usam nossos PRINCIPAIS indicadores🏆
Descubra por que os profissionais nos escolhem – as ferramentas mais poderosas no cTrader (indicadores, algoritmos e cBots) estão esperando por você.
👉 Obtenha todos os nossos PRINCIPAIS sistemas aqui:
_______________________________________________
📌 Indicadores de Estrutura de Mercado
· ✅ AdvancedMarket Structure: Bos, Choch, SwinLevels, Order Blocks, Market Structure& Liquidity Finder
· 🔄 Análise Dinâmica da Estrutura de Mercado de Pontos de Reversão
· 🧱 Bloco de Ordem
· ⛓️ BOS & CHOCH
· 🧠 ICT Power of 3
· 🌀 Zonas de Polaridade de Mercado
_______________________________________________
🔚 Sistemas Inteligentes de Saída
· 📍 Algoritmo Inteligente de Trailing
_______________________________________________
📐 Indicadores ZigZag
· 🔍 Projeção de Liquidez de Preço ZigZag
· ➖ ZigZag
· 🎯 Rastreador de Extremos Zig-Zag
_______________________________________________
🧱 Indicadores de Suporte & Resistência
· 🟩 Linhas Inteligentes de Suporte & Resistência SmartTrend
· 🧱 Todos os Níveis de Suporte e Resistência
_______________________________________________
📊 Indicadores de Tendência & Canal
· 🔄 Canal de Tendência Automático
· 📊 Supertrend
· ⚡Analisador de Tendência Momentum
· 🧠 Canal de Tendência Adaptativo
· 💥 Sistema de Rompimento de Canal
· 🌈 Gradiente Dinâmico de Tendência
_______________________________________________
💧 Ferramentas de Volume & Liquidez
· 📉 Mapa de Liquidação de Alavancagem
· 🔍 Gap de Valor Justo Momentum
· 🕒 Sessões de Gap de Valor Justo
_______________________________________________
⚡ Indicadores de Momentum & RSI
· 🚀 Momentum de Alcance Dinâmico
· 🔎 Viés de Vela Multi-Nível
Rastreador
_______________________________________________
🔮 Ferramentas de Previsão & Projeção
· 📐 Previsão Baseada em Linreg& ATR
· 📏 Regressão Linear Fibonacci Multi-tempo
· 📈 Projetor de Fluxo de Mercado Alimentado por Volume
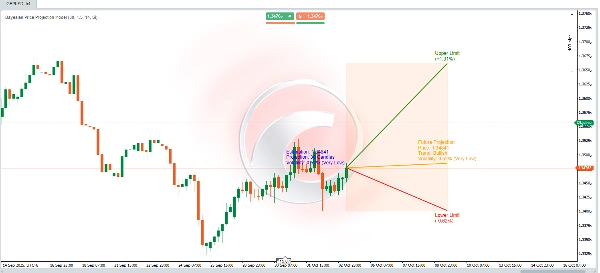
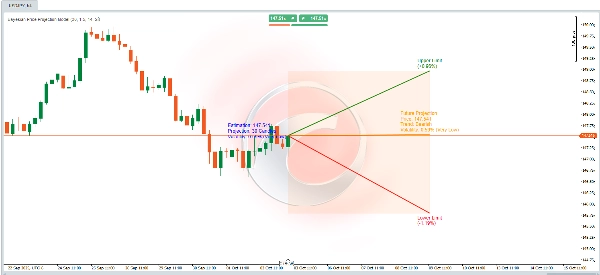
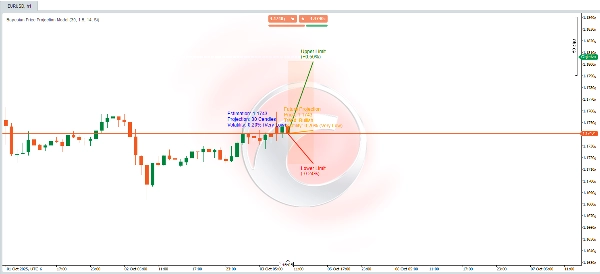
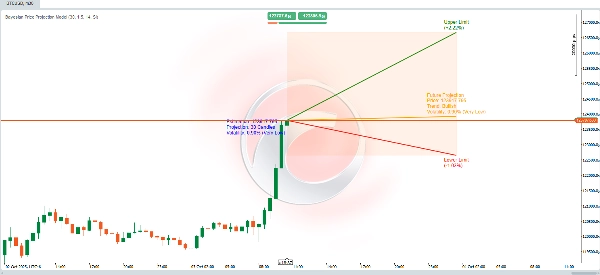
📊 Algoritmo Dinâmico de Projeção de Preço 📈
Este algoritmo combina **cálculos estatísticos**, **análise técnica** e **teoria bayesiana** para prever um preço futuro enquanto fornece **intervalos de incerteza** que representam limites superior e inferior. Os cálculos são projetados para ajustar as projeções considerando as **tendências** do mercado, **volatilidade** e as probabilidades históricas de atingir novos máximos ou mínimos.
Veja como funciona:
🚀 Projeção de Preço Futuro
Um cálculo dinâmico estima o preço futuro com base em três elementos-chave:
1. **Tendência**: Define se o mercado está predisposto a subir ou descer.
2. **Volatilidade**: Quantifica a magnitude da mudança esperada com base nas flutuações históricas.
🧠 **Ajuste Probabilístico Bayesiano**
- Probabilidades condicionais são calculadas usando a **fórmula de Bayes**:
\[
P(A|B) = \frac{P(B|A) \cdot P(A)}{P(B)}
\]
Isso modela eventos futuros usando informações condicionais:
- **Probabilidade de atingir um novo recorde histórico** se o preço estiver em tendência de alta.
- **Probabilidade de atingir um novo recorde mínimo histórico** se o preço estiver em tendência de baixa.
- Essas probabilidades refinam a estimativa do preço futuro considerando:
- **Maior volatilidade** aumenta a probabilidade de atingir níveis extremos (máximos/mínimos).
- **Tendências de mercado** influenciam a direção esperada do movimento do preço.
🌟 **Cálculo da Volatilidade**
- A volatilidade é medida usando o indicador **ATR (Average True Range)** com uma janela de 14 períodos. Isso reflete a amplitude média das flutuações de preço.
- Para expressar a volatilidade em porcentagem, o ATR é normalizado dividindo-o pelo preço de fechamento e multiplicando por 200.
- A volatilidade é então categorizada em níveis descritivos (por exemplo, **Muito Baixa**, **Baixa**, **Moderada**, etc.) para melhor interpretação.
---
🎯 **Limites de Desvio (Superior e Inferior)**
- Os limites superior e inferior formam um **intervalo projetado** em torno do preço futuro estimado, fornecendo uma estrutura para a incerteza.
- Esses limites são calculados ajustando o ATR usando:
- Um **multiplicador** definido pelo usuário (`factor_desviacion`).
- **Probabilidades bayesianas** calculadas anteriormente.
- A **raiz quadrada do período projetado** (`proyeccion_dias`), incorporando o princípio de que a incerteza cresce com o tempo.
🔍 **Interpretando o Modelo**
Isso pode ser visto como um **modelo probabilístico dinâmico** que:
- Combina **análise técnica** (tendências e ATR).
- Refina probabilidades usando a **teoria bayesiana**.
- Fornece um **intervalo de projeção visual** para ajudar a entender os potenciais movimentos futuros do preço e as incertezas associadas.
⚡ Quer você esteja analisando **mercados voláteis** ou confirmando **cenários de alta/baixa**, esta ferramenta oferece uma abordagem robusta e baseada em dados! 🚀