
Açıklama
Uyarlanabilir Takip Sistemi 🚀
Uyarlanabilir Takip Sistemi, kar koruma seviyelerini otomatik olarak ayarlamak için logaritmik normalize edilmiş volatilite kullanan gelişmiş bir uyarlanabilir takip stopudur. 📊 Sabit mesafeli geleneksel takip stoplarının aksine, bu sistem piyasanın gerçek volatilitesine dayalı dinamik mesafeler hesaplar ve değişen koşullara sürekli uyum sağlar. 🔄
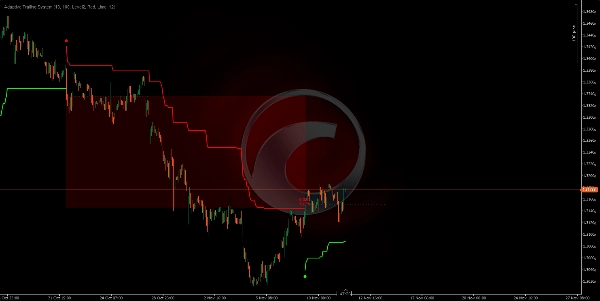
Spotware GBPUSD 691360763c684 | cTrader
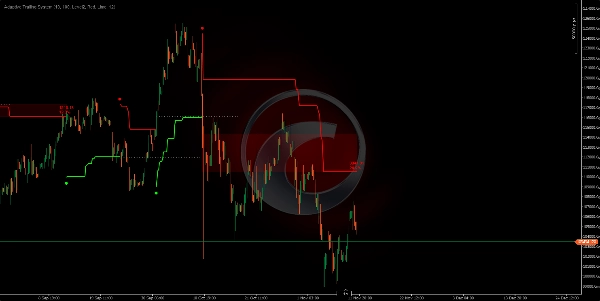
Spotware XAUUSD 691360adf1386 | cTrader
Spotware XAUUSD 691360adf1386 | cTrader
Benzersiz Uyarlanabilir Takip Algoritması ⚙️
Sistem, asla aynı takip mesafelerini üretmeyen istatistiksel bir yöntem kullanır:
• Belirlenebilir bir dönem boyunca fiyatın Gerçek Aralığını hesaplar.
• Dağılımı normalize etmek için bu değerlere logaritmik dönüşüm uygular.
• Bu logaritmik değerlerin ortalamasını ve standart sapmasını hesaplar.
• Volatilite seviyelerine (0, 1, 2 veya 3 standart sapma) dayalı olarak benzersiz bir offset mesafesi üretir. 🎯
• Takip stopu, tipik fiyat (Yüksek, Düşük, Kapanış ortalaması) kullanılarak sürekli ayarlanır.
Sonuç: Her piyasa anının, o bağlamın özgün volatilitesine göre hesaplanan kendi takip mesafesi vardır. 🤖
Teknik Temel: Logaritmik Normalize Edilmiş Volatilite 🧠
Neden logaritmik dönüşüm? 🤔
Piyasa volatilitesi normal (Gauss) dağılımı takip etmez; uç değerler eğilimindedir. Logaritmik dönüşüm:
- Dağılımı normalize eder: Çarpık veriyi daha simetrik bir dağılıma dönüştürür.
- Varyansı stabilize eder: Aşırı volatilite sıçramalarının etkisini azaltır.
- İstatistiksel karşılaştırmayı mümkün kılar: Standart sapmanın anlamlı kullanılmasını sağlar.
Offset Hesaplama Süreci 🔢
- Dönem Gerçek Aralığı: Dönemin Yüksek-Düşük aralığını ve önceki kapanışla boşlukları dikkate alarak maksimum aralığı ölçer.
- Doğal Logaritma:
ln(True Range)uygular ve normalize eder. - Normalize Etme Penceresi: Son N logaritmik değeri (normalize etme dönemi) tutar.
- Logaritmik Ortalama: Penceredeki tüm
ln(TR)değerlerinin ortalaması. - Standart Sapma: Logaritmik değerlerin dağılımını hesaplar.
- Volatilite Seviyesi: Konfigürasyona bağlı olarak sapmayı 0, 1, 2 veya 3 ile çarpar.
- Nihai Offset:
Offset = e^(ortalama + seviye × sapma)- fiyat ölçeğine geri dönüştürür. 💡
Nasıl Çalışır? ⚡
Çift Yönlü Takip Mekaniği
Sistem iki dönüşümlü modda çalışır:
DÜŞÜŞ Modu (Short): 📉
• Takip stopu fiyatın ÜSTÜNE yerleştirilir.
• Fiyat düştüğünde aşağı doğru güncellenir (asla yükselmez).
• Fiyat takip stopunun ÜSTÜNDE KAPANDIĞINDA geri dönüş sinyali oluşur.
YÜKSELİŞ Modu (Long): 📈
• Takip stopu fiyatın ALTINA yerleştirilir.
• Fiyat yükseldiğinde yukarı doğru güncellenir (asla düşmez).
• Fiyat takip stopunun ALTINDA KAPANDIĞINDA geri dönüş sinyali oluşur.
Geri Dönüş Sinyalleri:
• Dairesel bir nokta trend değişimini (yeni pozisyon girişi) işaret eder.
• Yeşil renk = Yeni yükseliş trendi (). ✅
• Kırmızı renk = Yeni düşüş trendi (). 🔴
Parametreler ve Etki 🎛️
Hesaplama Dönemi (10)
- Fonksiyon: Gerçek Aralığı hesaplamak için kaç barın kullanıldığını tanımlar.
- ↑ Yüksek (20-50): Daha uzun vadeli volatiliteyi ölçer, daha yumuşak, daha az hassas.
- ↓ Düşük (5-8): Kısa vadeli volatiliteyi ölçer, daha tepkisel, hızlı değişiklikleri algılar.
Normalize Etme Dönemi (100)
- Fonksiyon: Ortalama ve standart sapmayı hesaplamak için logaritmik değerlerin penceresi.
- ↑ Yüksek (200-500): Daha stabil normalize etme, offsette kademeli değişiklikler.
- ↓ Düşük (50-80): Daha tepkisel normalize etme, offset daha hızlı uyum sağlar.
- Kritik Etki: Bu parametre, tarihsel volatilite bağlamının ne kadar "hafızada tutulduğunu" belirler. 🧠
Volatilite Seviyesi (Seviye 2)
- Fonksiyon: Offset hesaplamasına uygulanan standart sapma sayısı.
- Seviye 0 (0σ): Offset = logaritmik ortalama = en sıkı mesafe, maksimum hassasiyet. 🎯
- Seviye 1 (1σ): Offset 1 sapma içerir = orta mesafe, ~%68 varyasyonu yakalar.
- Seviye 2 (2σ): Offset 2 sapma içerir = daha geniş mesafe, ~%95 varyasyonu yakalar (denge). ⚖️
- Seviye 3 (3σ): Offset 3 sapma içerir = çok geniş mesafe, ~%99 varyasyonu yakalar, maksimum tolerans. 🛡️
___________________________________________________________________________________________________
🚀 10.000+ trader zaten en iyi göstergelerimizi🏆 kullanıyor
👉 Tüm en iyi sistemlerimizi buradan edinin:
_______________________________________________
📌 Piyasa Yapısı Göstergeleri
· ✅ AdvancedMarket Structure: Bos, Choch, SwinLevels, Order Blocks, Market Structure& Likidite Bulucu
· 🔄 Dynamic Market StructureAnalysis of Turning Points
· 🧱 Order Block
· ⚖️ Market Imbalance
· ⛓️ BOS & CHOCH
· 🧠 ICT Power of 3
_______________________________________________
🔚 Akıllı Çıkış Sistemleri
· 📍 Takip Eden Akıllı Algoritma
_______________________________________________
📐 ZigZag Göstergeleri
· 🔍 ZigZag Fiyat Likidite Projeksiyonu
· ➖ ZigZag
· 🎯 Zig-Zag Uç Nokta Takipçisi
_______________________________________________
🧱 Destek & Direnç Göstergeleri
· 🟩 SmartTrend Destek & Direnç Çizgileri
· 🧱 Tüm Destek ve Direnç Seviyeleri
_______________________________________________
📊 Trend & Kanal Göstergeleri
· 📊 Supertrend
· 🧠 Uyarlanabilir Trend Kanalı
· 🔁 Tepkisel Hareketli Ortalama
_______________________________________________
💧 Hacim & Likidite Araçları
· 🔍 Momentum Adil Değer Boşluğu
· 🕒 Adil Değer Boşluğu Seansları
_______________________________________________
⚡ Momentum & RSI Göstergeleri
· 🔎 Çok Katmanlı Mum Önyargısı
Takipçisi
_______________________________________________
🔮 Tahmin & Projeksiyon Araçları
· 📐 Linreg & ATR Tabanlı Tahmin
· 📏 Fibonacci Doğrusal Regresyon Çok Zamanlı Çerçeve
· 📈 Hacim Destekli Piyasa Akışı Projeksiyonu_________________________________________________________________________________________________
Özet
The system operates bidirectionally with two modes:
- Bearish (short) mode places the trailing stop above the price, adjusting downward as price falls, signaling a reversal when price closes above the stop.
- Bullish (long) mode places the trailing stop below the price, adjusting upward as price rises, signaling a reversal when price closes below the stop.
Reversal signals are visually marked with colored dots indicating trend changes (green for bullish, red for bearish). Key parameters include the calculation period for True Range, normalization period for volatility data, and volatility level defining the offset distance based on standard deviations.
This indicator supports various markets including Forex, cryptocurrencies, commodities, indices, and stocks, with symbols such as BTCUSD, EURUSD, GBPUSD, XAUUSD, NAS100, and USDJPY. It is designed to provide adaptive trailing stops that respond to real-time volatility, enhancing trade exit strategies.


!["[Stellar Strategies] MARSI Signal Plotter" logosu](https://cdn.ctrader.com/image/webp/7b2b8da6-8f8e-4646-8d4a-4710c516c01e_25567)


