Mô tả
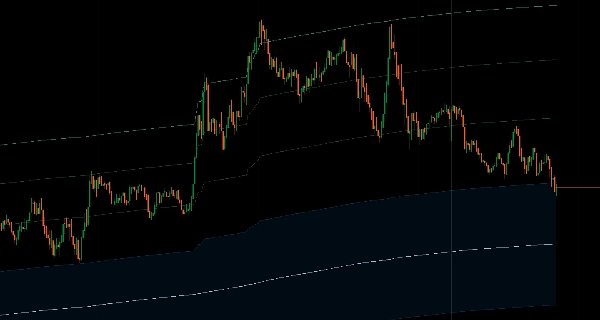
Khóa tính toán trung bình động vào bất kỳ thời điểm thị trường nào và theo dõi hành vi giá khi nó mở rộng về phía trước.
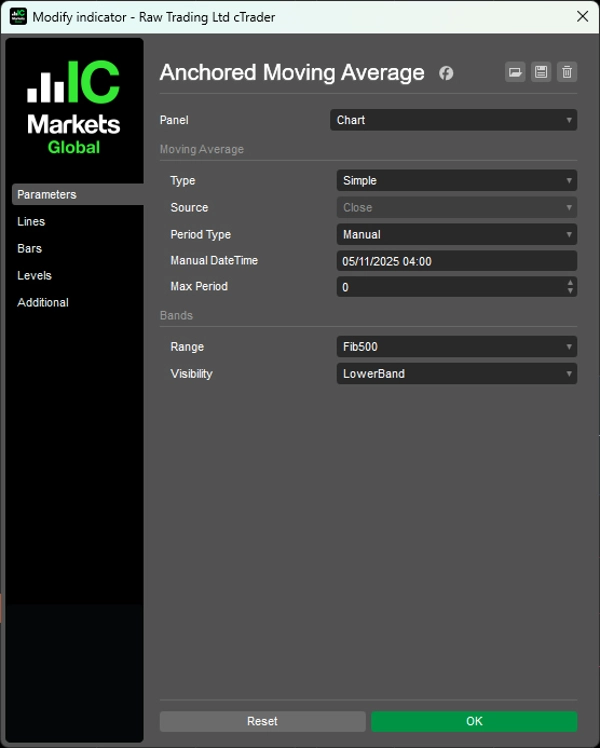
Ghim tính toán vào điểm bắt đầu bạn chọn (ngày giờ thủ công hoặc khoảng thời gian nhìn lại từ 1 giờ đến 10 năm), sau đó phát triển tự nhiên với các dải Fibonacci thích ứng dựa trên phạm vi giá thực tế.
Tám mức Fibonacci (11,4% đến 100%) thích ứng với chuyển động giá thực, vùng hồi quy trung bình tích hợp 38,2%-62,8%, hai loại MA (SMA/EMA), nhiều chế độ hiển thị (toàn bộ dải, chỉ biên cực đoan, chỉ vùng hồi quy), và giới hạn chu kỳ tối đa cho khung thời gian dài cung cấp theo dõi động lượng dựa trên sự kiện cho các nhà giao dịch nhắm mục tiêu hồi lại từ các điểm dao động quan trọng và phân tích hành vi giá sau sự kiện.
TÍNH NĂNG
Tính Toán Neo Thời Gian
- Không giống như các MA tiêu chuẩn sử dụng chu kỳ cố định, cái này phát triển tự nhiên từ điểm bắt đầu bạn chọn
- Neo linh hoạt: Đặt ngày giờ thủ công hoặc sử dụng các khoảng thời gian nhìn lại đã định trước (1 giờ đến 10 năm)
- Theo dõi động lượng từ các thời điểm thị trường quan trọng
- Điểm neo nhất quán trên các khung thời gian khác nhau
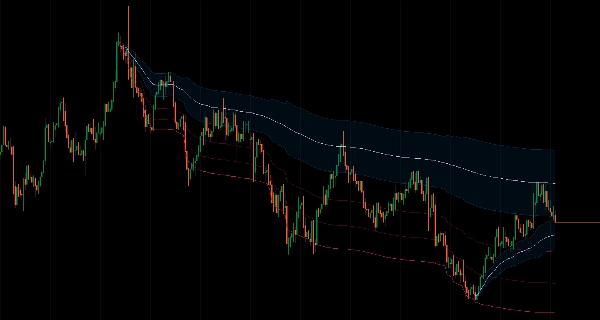
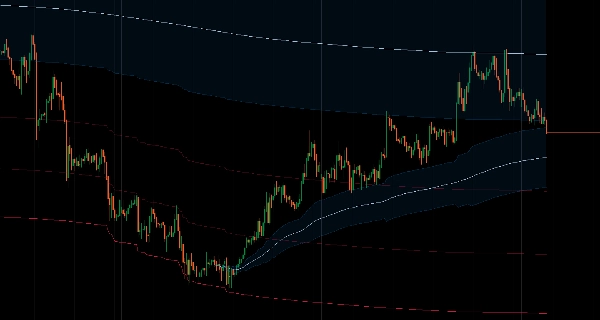
Dải Fibonacci Thích Ứng
- Dải tự động tính toán dựa trên phạm vi giá thực tế, không phải bội số ATR tùy ý
- 8 mức Fibonacci (11,4% đến 100%) thích ứng với chuyển động giá thực
- Vùng hồi quy trung bình: Vùng hồi quy tích hợp 38,2%-62,8% cho các khu vực vào lệnh có xác suất cao
- Vùng xác suất được xác định bằng toán học
Hai Loại MA
- Trung Bình Động Đơn Giản
- Trung Bình Động Lũy Thừa
- Giới hạn chu kỳ tối đa: Ngăn chặn làm mượt quá mức trên các khung thời gian dài
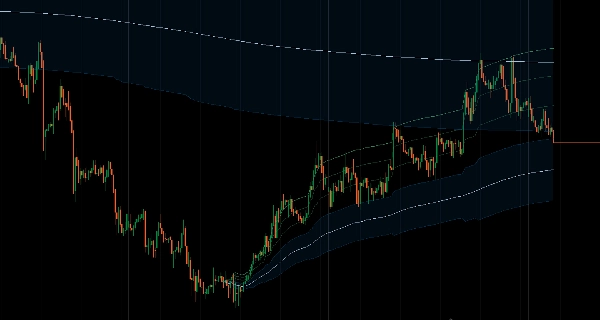
Nhiều Chế Độ Hiển Thị
- Toàn bộ dải: Hiển thị tất cả các mức Fibonacci
- Chỉ trên/dưới: Hiển thị biên cực đoan
- Chỉ vùng hồi quy: Tập trung vào khu vực hồi quy trung bình
- Thiết kế sạch sẽ, có mục đích, không rối mắt
Phân Tích Dựa Trên Sự Kiện
- Xem giá hiện tại liên quan thế nào đến chuyển động từ các mức quan trọng
- Theo dõi hành vi giá sau sự kiện
- Vào lệnh dựa trên cấu trúc với các điểm tham chiếu rõ ràng
__________________________________________________________________________________________
NHIỀU CHỈ BÁO MIỄN PHÍ HƠN
Khám phá nhiều công cụ phân tích thị trường — từ cấu trúc và khối lượng đến hồi quy, biến động và khung thời gian tùy chỉnh.
Mã nguồn có sẵn trên kho GitHub.
Tất cả đều miễn phí sử dụng. Nhưng nếu bạn muốn hỗ trợ cà phê, bạn có thể gửi tại đây.
Hỗ Trợ/Kháng Cự
Khối Lượng
- Volume Activity Profiler
- Volume Efficiency Analyzer
- Volume Profile Analytics
- Volume Profile - Updated
- Volume Spread Analysis
- VWAP (Volume Weighted Average Price)
Trung Bình Động
- SSL Channel
- Anchored Moving Average
- Deviation-Scaled Moving Average
- Gann High Low Activator
- Instantaneous Trendline
- Kaufman Adaptive MA with Trend Vision
- Moving Average Channel
- Moving Averages Suite
- Trend Channel Moving Average
Tiện Ích/Tùy Chỉnh
Dựa Trên Hồi Quy
Biến Động
Bộ Dao Động
__________________________________________________________________________________________
TỪ CHỐI TRÁCH NHIỆM
Giao dịch có rủi ro. Chỉ báo này chỉ dành cho phân tích kỹ thuật — luôn áp dụng quản lý rủi ro phù hợp và giao dịch có trách nhiệm.
PHẢN HỒI & CẢI TIẾN
Nếu bạn có đề xuất, yêu cầu tính năng hoặc ý tưởng cải tiến, vui lòng để lại bình luận trong tab Thảo luận. Phản hồi của bạn giúp cải thiện chỉ báo cho mọi người.
Tóm tắt
The indicator features adaptive Fibonacci bands calculated based on the actual price range, not arbitrary multiples. It includes eight Fibonacci levels from 11.4% to 100%, with a built-in mean reversion zone between 38.2% and 62.8%, providing mathematically defined probability zones for potential entry areas. Multiple display modes are available, including full bands, extreme boundaries only, or reversion zone only, designed for a clean and purposeful chart presentation.
This tool facilitates analysis of price behavior relative to significant swing points or events, supporting structured entries and post-event price tracking. It is intended for technical analysis and includes a disclaimer advising responsible trading with proper risk management.
Đánh giá của khách hàng
5 | 100 % | |
4 | 0 % | |
3 | 0 % | |
2 | 0 % | |
1 | 0 % |