

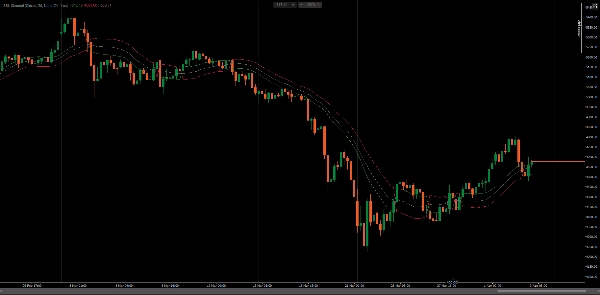
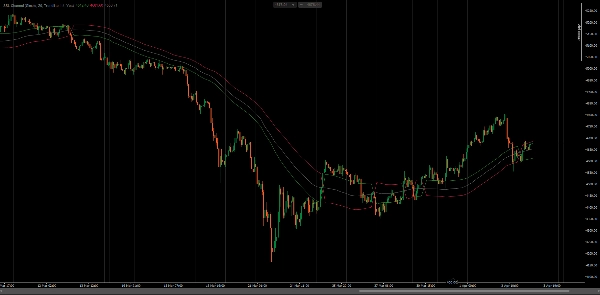

Mô tả
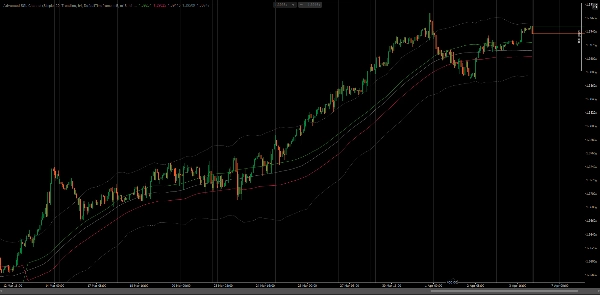
Kênh SSL dựa trên MA với các chế độ đa khung thời gian, bao bọc ATR và tô màu thanh.
Theo dõi hướng xu hướng bằng cách so sánh giá đóng cửa với các đường trung bình động của Cao và Thấp. Trạng thái chuyển sang tăng khi giá đóng cửa vượt lên trên MA(Cao) với độ tin cậy đủ, giảm khi nó rơi xuống dưới MA(Thấp) — vẽ các dải SSL Up và SSL Down tương ứng, với MA Đóng cửa làm lớp phủ bổ sung.
Bốn chế độ tính toán (Không, Nội suy, Thời kỳ tỷ lệ, Đường xu hướng), bao bọc dựa trên ATR để lọc nhiễu, tô màu thanh, phân giải mẫu khung thời gian và chiếu đường xu hướng cung cấp một khung SSL hoàn chỉnh cho các nhà giao dịch làm việc trên nhiều khung thời gian và phong cách phân tích khác nhau.
TÍNH NĂNG
Logic Kênh Cốt lõi
- SSL Up: vẽ MA(Cao) trong trạng thái giảm, MA(Thấp) trong trạng thái tăng — kháng cự/hỗ trợ động
- SSL Down: vẽ dải đối diện để phân tách trực quan rõ ràng
- Đầu ra MA Đóng cửa để lớp phủ bổ sung về xu hướng
- Hỗ trợ tất cả các loại trung bình động cTrader (SMA, EMA, DEMA, TEMA, WMA, v.v.)
Bao Bọc ATR
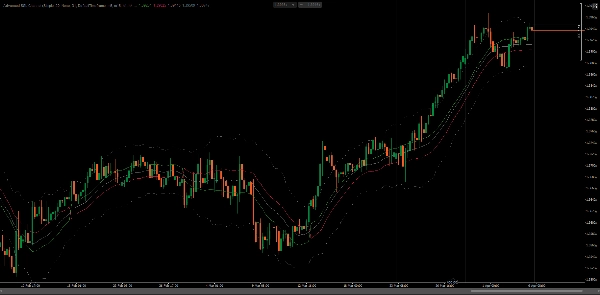
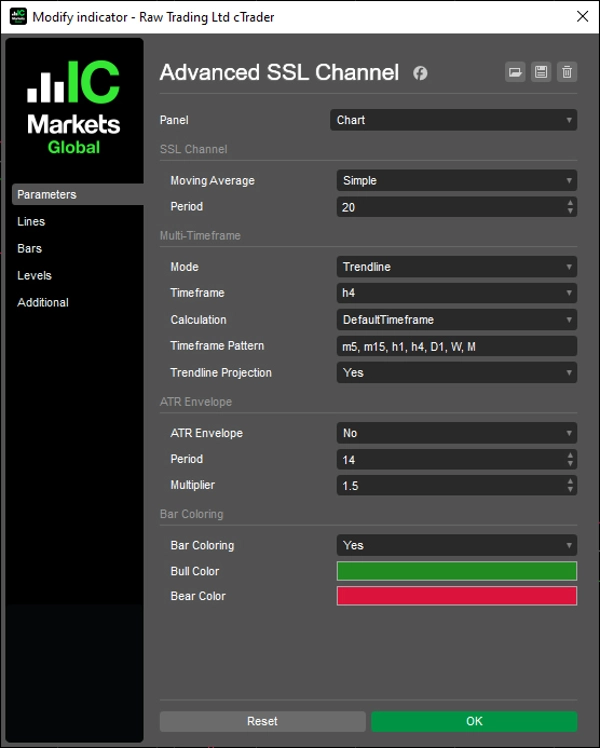
- Thêm một bộ đệm dựa trên ATR quanh các dải SSL để lọc các chuyển đổi sai do nhiễu
- Chỉ chuyển đổi trạng thái khi giá đóng cửa vượt qua MA(Cao/Thấp) hơn ATR × Hệ số nhân
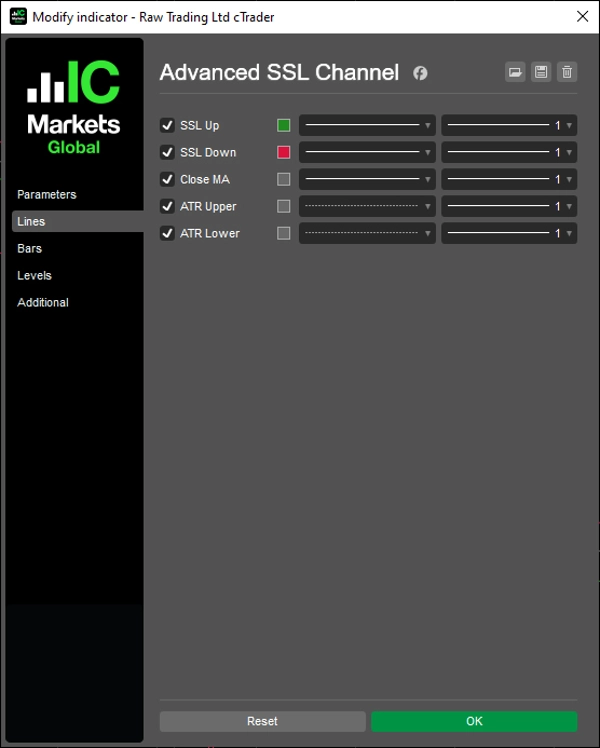
- Các dải ATR Trên và ATR Dưới được hiển thị dưới dạng các đầu ra riêng biệt để tham khảo trực quan
- Ở chế độ Đường xu hướng, các dải ATR được vẽ dưới dạng các đối tượng đường xu hướng — mượt mà, không bậc thang
- Ở chế độ Nội suy, các giá trị ATR được nội suy tuyến tính qua các thanh LTF phù hợp với hành vi SSL
- Cấu hình được chu kỳ ATR và hệ số nhân
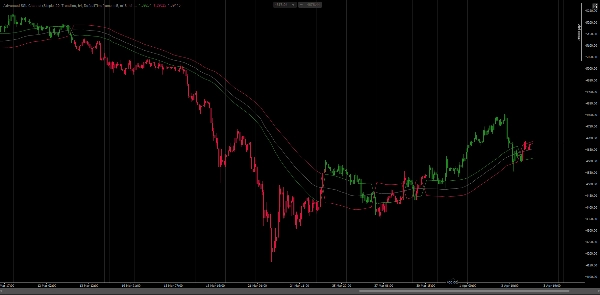
Tô Màu Thanh
- Tô lại nến biểu đồ dựa trên trạng thái SSL hiện tại — xanh cho tăng, đỏ cho giảm
- Màu tăng và giảm hoàn toàn có thể cấu hình
- Bật/tắt mà không ảnh hưởng đến đầu ra dải SSL
Chế Độ Đa Khung Thời Gian
- Không: tính toán khung thời gian đơn tiêu chuẩn trên biểu đồ hiện tại
- Nội suy: giá trị HTF được ánh xạ tuyến tính lên các thanh LTF để tạo lớp phủ liên tục mượt mà
- Thời kỳ tỷ lệ: tỷ lệ chu kỳ theo tỷ lệ HTF sang LTF — không cần chuỗi dữ liệu bổ sung
- Đường xu hướng: vẽ các đối tượng đường xu hướng biểu đồ giữa các ranh giới thanh HTF với kiểm soát kiểu dáng đầy đủ
Phân Giải Khung Thời Gian
- Khung thời gian mặc định: chọn thủ công bất kỳ HTF nào từ menu thả xuống tham số
- Mẫu khung thời gian: tự động chọn khung thời gian cao hơn gần nhất từ danh sách token phân tách bằng dấu phẩy (ví dụ,
m5, m15, h1, h4, D1, W, M) - Các token mẫu hỗ trợ phút (m1–m45), giờ (h1–h12), ngày (d1–d3), hàng tuần (W), và hàng tháng (M)
Phần Bổ Sung Chế Độ Đường Xu Hướng
- Kiểm soát màu sắc, độ dày và kiểu dáng độc lập cho mỗi đường đầu ra
- Đoạn chiếu mở rộng đoạn HTF cuối cùng một thanh về phía trước để dự đoán
- Lịch sử giới hạn 100 đoạn để hiệu suất biểu đồ sạch sẽ
Tùy Chỉnh Toàn Diện
- Cấu hình loại MA và chu kỳ
- Kiểu dáng đường đầu ra kế thừa bởi các đối tượng đường xu hướng ở chế độ Đường xu hướng
- Tự động chuyển về khung thời gian hiện tại khi HTF ≤ khung thời gian biểu đồ
__________________________________________________________________________________________
NHIỀU CHỈ BÁO MIỄN PHÍ HƠN
Khám phá nhiều công cụ phân tích thị trường — từ cấu trúc và khối lượng đến hồi quy, biến động và khung thời gian tùy chỉnh.
Mã nguồn có sẵn trên kho lưu trữ GitHub repository.
Tất cả đều miễn phí sử dụng. Nhưng nếu bạn muốn gửi hỗ trợ cà phê, bạn có thể chuyển đến đây.
Hỗ Trợ/Kháng Cự
Khối Lượng
- Volume Activity Profiler
- Volume Efficiency Analyzer
- Volume Profile Analytics
- Volume Profile - Updated
- Volume Spread Analysis
- VWAP (Giá Trung Bình Trọng Số Khối Lượng)
Trung Bình Động
- Kênh SSL
- Trung Bình Động Neo
- Trung Bình Động Tỷ Lệ Độ Lệch
- Bộ Kích Hoạt Cao Thấp Gann
- Đường Xu Hướng Tức Thời
- MA Thích Ứng Kaufman với Tầm Nhìn Xu Hướng
- Kênh Trung Bình Động
- Bộ Trung Bình Động
- Kênh Trung Bình Động Xu Hướng
Tiện Ích/Tùy Chỉnh
Dựa Trên Hồi Quy
Biến Động
Bộ Dao Động
__________________________________________________________________________________________
TỪ CHỐI TRÁCH NHIỆM
Giao dịch có rủi ro. Chỉ báo này chỉ dành cho phân tích kỹ thuật — luôn áp dụng quản lý rủi ro thích hợp và giao dịch có trách nhiệm.
PHẢN HỒI & CẢI TIẾN
Nếu bạn có đề xuất, yêu cầu tính năng hoặc ý tưởng cải tiến, vui lòng để lại bình luận trong tab Thảo luận. Phản hồi của bạn giúp cải thiện chỉ báo cho mọi người.
Tóm tắt
Key features include four calculation modes—None, Interpolated, ScaledPeriod, and Trendline—allowing flexible multi-timeframe analysis. An ATR-based envelope filters out noise by requiring price crosses to exceed a configurable ATR multiplier before state changes. The indicator supports all cTrader moving average types (SMA, EMA, DEMA, TEMA, WMA, etc.) and provides bar coloring to visually distinguish bullish and bearish states with customizable colors.
Timeframe resolution options include manual selection or automatic pattern-based higher timeframe detection. In Trendline mode, SSL bands and ATR envelopes are rendered as smooth trendline objects with independent style controls and projection segments for anticipating price movement. The indicator is suitable for traders using various analysis styles and timeframes, offering full customization of moving average types, periods, and visual styles.
Đánh giá của khách hàng
5 | 100 % | |
4 | 0 % | |
3 | 0 % | |
2 | 0 % | |
1 | 0 % |
Thảo luận
Câu hỏi thường gặp
Sản phẩm khác của tác giả này
























Giá