
Mô tả
Pinescritlabs
Chỉ báo Ctrader Store: 🤖Pinescritlabs Ctrader Store cBots:
Phiên Chênh Lệch Giá Công Bằng Phiên Đột Phá Vàng & BTC Pivots
Cấu Trúc Thị Trường Động
Phân Tích Điểm Quay
Fibonacci Tuyến Tính
Hồi Quy Đa Khung Thời Gian
Chênh Lệch Giá Công Bằng Động Lực
Định Hướng Nến Đa Cấp
Theo Dõi
Hỗ Trợ Tự Động và
Đường Xu Hướng Kháng Cự
Tất Cả Các Mức Hỗ Trợ và
Kháng Cự
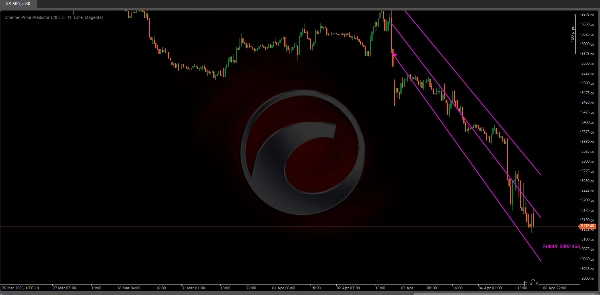
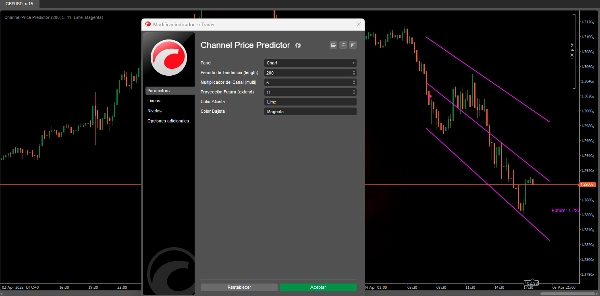
Bộ Dự Báo Giá Kênh xác định và vẽ một kênh xu hướng (có thể là tăng giá hoặc giảm giá) trên biểu đồ, mở rộng nó về phía trước để dự đoán các vùng giá có thể xảy ra. 📈🔮
Kênh dựa trên ATR (Average True Range), đo lường độ biến động thị trường. Độ biến động gần đây càng cao, kênh càng rộng, giúp hình dung phạm vi các chuyển động có thể xảy ra. 📊💥
Nó tự động xác định và vẽ các kênh dựa trên các điểm pivot cao và thấp.
Tùy chọn mở rộng các đường kênh và dự báo giá tương lai của chúng. 🕒📉
Kênh này không chỉ hiển thị chuyển động hiện tại mà còn cung cấp dự báo giá ước tính cho tương lai thông qua nhãn (“Tương lai: …”) chỉ ra giá trị có thể xảy ra. 📅💡
Nó dùng để làm gì?
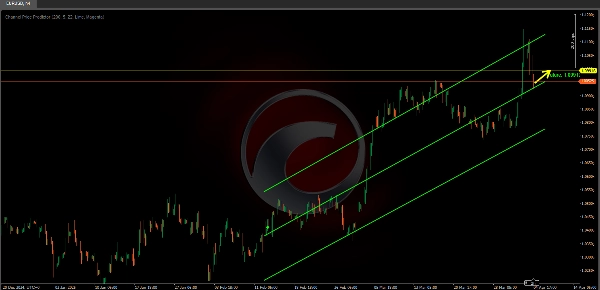
Xác định Xu Hướng:
Chỉ báo sử dụng logic nội bộ để phát hiện khi thị trường chuyển từ tăng giá sang giảm giá (hoặc ngược lại). Bằng cách này, bạn có thể hình dung rõ hơn liệu tài sản đang trong giai đoạn tăng hay giảm. 📈🔄📉
Kênh Biến Động:
Kênh dựa trên ATR (Average True Range), đo lường độ biến động. Độ biến động gần đây càng cao, kênh càng rộng. Điều này giúp bạn thấy phạm vi các chuyển động có thể xảy ra. 📊🔍
Dự Báo Tương Lai:
Chỉ báo không chỉ hiển thị xu hướng hiện tại mà còn mở rộng kênh vài chu kỳ về phía trước (có thể cấu hình), để bạn có thể dự đoán các vùng hỗ trợ/kháng cự trong xu hướng đó. ⏳🚀
Nó cho phép bạn mở rộng các đường kênh và dự báo giá tương lai của chúng. ⬆️⬇️
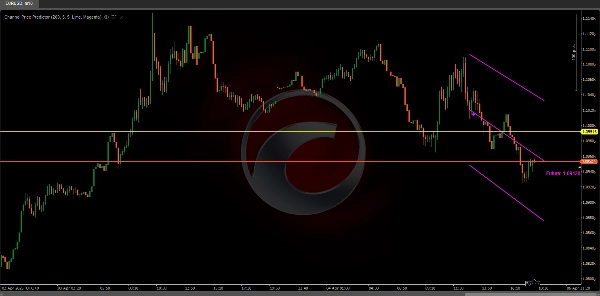
Tham Chiếu Giá:
Bằng cách vẽ đường trung tâm và các cạnh trên dưới, nó cung cấp các tham chiếu để bạn đặt điểm dừng, mục tiêu, hoặc thậm chí quản lý vào/ra lệnh với nhiều thông tin hơn về biến động. 🎯📍
Do hạn chế của cTrader, hiện tại không thể cuộn sang phải trên biểu đồ để xem đầy đủ các phần mở rộng tương lai của kênh.
Khuyến nghị đặt tham số “Dự Báo Tương Lai” ở giá trị dưới 25 chu kỳ để tránh lỗi hiển thị.
Khi cTrader triển khai khả năng mở rộng biểu đồ về phía trước, chúng tôi sẽ cải tiến thuật toán để tận dụng tối đa chức năng này.
Tóm tắt
Key features include automatic detection of trend direction changes, visualization of current trend channels, and the ability to extend channel lines into the future. This future projection helps anticipate potential support and resistance zones by displaying estimated price values labeled as “Future: …”. The indicator draws a central line along with upper and lower channel boundaries, providing reference points for placing stops, targets, and managing trade entries and exits with volatility context.
Users can configure the number of periods for future projection, with a recommended maximum of 25 periods to avoid display issues due to cTrader platform limitations. The indicator supports analysis of various markets including cryptocurrencies (e.g., BTCUSD), commodities (e.g., XAUUSD), and others where volatility and trend identification are relevant.
Đánh giá của khách hàng
5 | 100 % | |
4 | 0 % | |
3 | 0 % | |
2 | 0 % | |
1 | 0 % |


