
Mô tả
Chỉ báo Pinescriptlabs Store: 🤖Pinescriptlabs Store cBots : (cBot)
Gold & BTC BreakoutSession Pivots(mới)
Hỗ Trợ &
Kháng Cự SmartTrend
Lines
Phân tích
Cấu Trúc Thị Trường
Động
của
Điểm Quay
Fibonacci
Hồi Quy Tuyến Tính
Đa khung thời gian
Multi-timeframe
Khe Giá Trị Công Bằng Động Lực
Theo Dõi
Định Hướng Nến
Đa Cấp
Tự Động
Hỗ Trợ và
Kháng Cự
Đường Xu Hướng
Lines
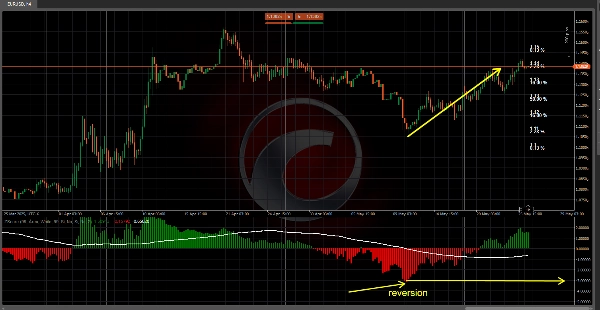
Z-Score biến đổi giá thành một thang đo "độ lệch chuẩn"
,"cho thấy mức độ đóng cửa (hoặc mở, cao, thấp) của mỗi cây nến lệch khỏi trung bình lịch sử của nó. Với một trực quan dễ hiểu, nó giúp xác định các điều kiện bán quá mức/mua quá mức
và các vùng đảo chiều có xác suất cao! 🔄
1️⃣ Nó Làm Gì?
🔹 Chuẩn Hóa Giá: Chuyển đổi giá đóng cửa tuyệt đối thành một Z-Score—bao nhiêu độ lệch chuẩn so với trung bình
của N thanhgần nhất.
🔹 Nổi Bật
Các Cực Thống Kê: Giá trị
gần ±1, ±2, hoặc ±3 chỉ ra sự hiếm gặp trong biến động giá:
- ±1 SD (≈ 68% xác suất nằm giữa –1 và 1)
- ±2 SD (≈ 95% xác suất nằm giữa –2 và 2)
- ±3 SD (≈ 99.7% xác suất nằm giữa –3 và 3)
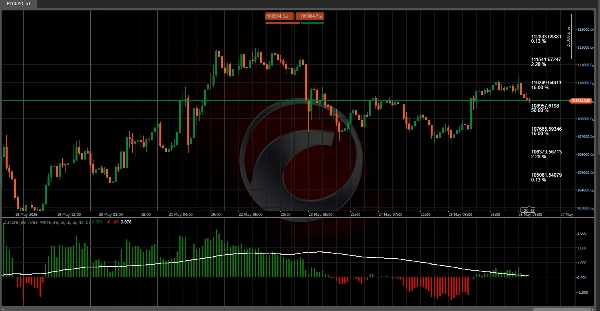
🔹 Hỗ Trợ
giao dịch đảo chiều theo trung bình:
Khi Z-Score vượt quá ±2 hoặc ±3, thị trường đang ở vùng
cực đoan và có xu hướng
đảo chiều về trung bình (zero).
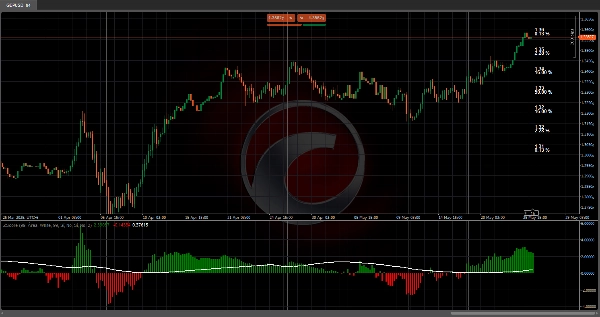
🔹 Trực Quan Rõ Ràng
: Sử dụng biểu đồ cột (hoặc nến đặc biệt), đường trung bình động và các vùng màu sắc, bạn có thể ngay lập tức thấy giá đang hành xử "bình thường" hay là một
ngoại lệ thống kê.
2️⃣ Nó Hoạt Động Như Thế Nào?
📐 Tính Trung Bình & Độ Lệch Chuẩn
- Một
khoảng nhìn lại (ví dụ, 99
thanh) được sử dụng. - Trung bình
và độ lệch chuẩn (SD) của
giá đóng cửa được tính toán. - SD cao hơn = Biến động giá lớn hơn.
🧮 Công Thức Z-Score
Z=Close Hiện Tại−Trung Bình Lịch SửĐộ Lệch ChuẩnZ=Độ Lệch ChuẩnClose Hiện Tại−Trung Bình Lịch Sử
- Z dương → Đóng cửa trên trung bình.
- Z âm → Đóng cửa dưới trung bình.
📊 Xác Suất Bảng Z
- Nổi bật cột Z-Score hiện tại để cho thấy giá hiếm/cực đoan đến mức nào!
3️⃣ Cách Sử Dụng Trong Giao Dịch
✅ Giao Dịch Đảo Chiều Trung Bình: Tìm Z > +2 hoặc Z < –2 để giao dịch đảo chiều (bán khi mua quá mức
cực đoan, mua khi bán quá mức cực đoan).
✅ Xác Nhận Xu Hướng: Z duy trì trên 0 + đường trung bình động tăng
> 0 + đường trung bình động tăng báo hiệu
sức mạnh; Z < 0 + đường trung bình động giảm cho thấy sự yếu kém.
✅ Quản Lý Rủi Ro: Gần ±1 SD, dự kiến các biến động bình thường; gần ±3
SD, điều chỉnh điểm dừng và
kích thước vị thế cẩn thận.
✅ Thời Điểm Vào Lệnh: Kết hợp các Z-Score cực đoan với các mức hỗ trợ/kháng cự
để vào lệnh chính xác.
4️⃣ Ưu Điểm & Lưu Ý
✔️ Ưu Điểm
- Lợi thế thống kê trong việc phát hiện các điều kiện giá cực đoan.
- Nhiều chế độ hiển thị (biểu đồ cột, nến, dải, bảng xác suất).
- Dễ dàng tùy chỉnh (độ dài, màu sắc, loại biểu đồ).
⚠️ Lưu Ý:
- Trong các
xu hướng mạnh, giá có thể duy trì trạng thái
"cực đoan" trong thời gian dài mà không đảo chiều. - Giả định phân phối
bình thường—có thể không hoạt động tốt trong các thị trường biến động cao/thiên lệch. - Tốt nhất nên sử dụng trong các môi trường
biến động ổn định.
Tóm tắt
The indicator calculates the mean and standard deviation of recent closing prices to determine the Z-Score using the formula:
Z = (Current Close − Historical Mean) / Standard Deviation.
Positive Z-Scores indicate prices above the mean, while negative scores indicate prices below it.
ZScore Reversion provides clear visualizations through histograms, special candles, moving averages, and colored zones to distinguish normal price behavior from statistical outliers. It supports mean reversion trading by signaling when prices exceed ±2 or ±3 standard deviations, suggesting a likely return to the mean. It also aids trend confirmation by interpreting sustained positive or negative Z-Scores combined with moving average trends.
Risk management is facilitated by adjusting stops and position sizes near extreme Z-Score values. Entry timing can be refined by combining extreme Z-Scores with support and resistance levels. The indicator offers multiple display modes and customization options for length, colors, and chart types. It is best suited for stable volatility environments and assumes a normal distribution of price data.
Đánh giá của khách hàng
5 | 100 % | |
4 | 0 % | |
3 | 0 % | |
2 | 0 % | |
1 | 0 % |


