Mô tả
Chỉ báo Pinescriptlabs Store: 🤖Pinescriptlabs Store cBots:
SmartTrend Support &
Resistance Lines Gold & BTC BreakoutSession Pivots(new)YieldShield" 🛡️
Dynamic Market Structure
Analysis of Turning Points
Fibonacci Linear
Regression Multi-timeframe
Multi-Level Candle Bias
Tracker
Auto Support and
Resistance Trend Lines
All Support and
Resistance Levels
Chỉ báo ShieldedTrend dựa trên sự kết hợp thông minh của hai phương pháp giao dịch phổ biến: nến Heikin-Ashi 📊 và đường trung bình động hàm mũ (EMA) 📈. Dưới đây là logic từng bước:
1️⃣ Cơ sở: Nến Heikin-Ashi đã được chỉnh sửa
Nến Heikin-Ashi là phiên bản làm mượt của nến truyền thống, được thiết kế để lọc bỏ nhiễu thị trường. Công thức gốc của chúng sử dụng trung bình giá, nhưng ShieldedTrend chỉnh sửa chúng theo hai cách chính:
- Đóng nến Heikin-Ashi:
Được tính bằng trung bình của 4 giá chính của nến thực:
(Mở + Cao + Thấp + Đóng) / 4 🔄. - Mở nến Heikin-Ashi:
Không lấy trực tiếp từ giá thực, mà là trung bình của giá mở và đóng của cây nến Heikin-Ashi trước đó.
Điều này tạo ra một hiệu ứng "làm mượt" tự nhiên loại bỏ các biến động đột ngột, giúp xu hướng rõ ràng hơn.
2️⃣ Làm mượt với EMA
ShieldedTrend áp dụng đường trung bình động hàm mũ (EMA) cho cả hai thành phần của nến Heikin-Ashi:
- Đường Mở đã làm mượt:
EMA áp dụng cho giá mở của nến Heikin-Ashi. - Đường Đóng đã làm mượt:
EMA áp dụng cho giá đóng của nến Heikin-Ashi.
EMA ưu tiên dữ liệu gần đây hơn, cho phép chỉ báo phản ứng nhanh với sự thay đổi xu hướng trong khi vẫn giữ được độ mượt.
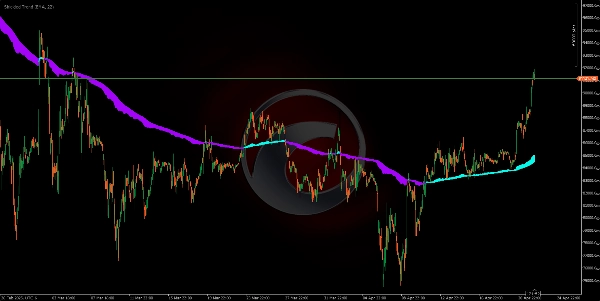
3️⃣ "Vùng Bảo Vệ" (Khiên) 🛡️
Khu vực màu sắc giữa hai đường (đường mở và đóng đã làm mượt) đóng vai trò như một vùng đệm hoặc xác nhận:
- Chiều rộng vùng:
Phụ thuộc vào sự khác biệt giữa hai đường. -
- Vùng rộng = Xu hướng mạnh (các đường cách xa nhau) 💪.
- Vùng hẹp = Do dự hoặc xu hướng yếu 🤔.
4️⃣ Logic Giao Dịch Tích Hợp
- Tín hiệu xu hướng:
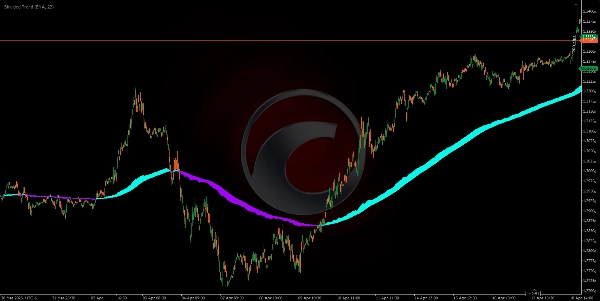
Thay đổi màu sắc báo hiệu khả năng đảo chiều (ví dụ, từ xanh lam sang tím = có thể bắt đầu xu hướng giảm) 🔵🟣. - Độ mạnh xu hướng:
Chiều rộng của vùng màu sắc đóng vai trò như một bộ lọc độ tin cậy: -
- Chỉ giao dịch nếu vùng đủ rộng (tránh thị trường nhiễu) ✅.
- Bảo vệ chống lại các biến động giả:
Nếu vùng đột ngột thu hẹp, điều đó cho thấy xu hướng hiện tại có thể đang mất đà—dù màu sắc chưa thay đổi ⚠.
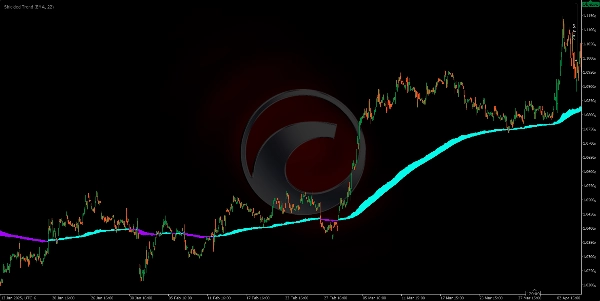
🌟 Tại sao nó hiệu quả?
- Heikin-Ashi + EMA: Làm mượt giá hai lần (nến + trung bình động), lọc bỏ 90% nhiễu 🎯.
- Vùng Bảo Vệ: Tránh giao dịch trong thị trường không rõ ràng, giảm các giao dịch thất bại 📉➡️📈.
- Phương pháp trực quan: Sự kết hợp giữa màu sắc và vùng giúp ngay cả nhà giao dịch mới nhận biết các mẫu nhanh chóng ⚡.
Tóm tắt
The indicator applies EMA smoothing to both the Heikin-Ashi open and close lines, enabling quick reaction to trend changes while maintaining smoothness. The area between these two smoothed lines forms a "Protection Zone" or shield, which acts as a buffer and confirmation zone. The width of this zone indicates trend strength: a wide zone signals a strong trend, while a narrow zone suggests indecision or a weak trend.
ShieldedTrend’s integrated trading logic uses color changes to signal potential trend reversals and the zone width as a confidence filter to avoid trading in choppy markets. The indicator helps protect against false moves by signaling when trend momentum is weakening even before a color change occurs. Its visual design facilitates quick pattern recognition, making it accessible for traders of all experience levels.