说明
概述
成交量效率分析器 是一个全面的逐根柱分析工具,用于衡量成交量(努力)与价格变动(结果)之间的关系。它最初是为个人使用而构建,以回答一个特定的问题: “市场是否高效运行,还是有大量活动却没有实质性进展?”
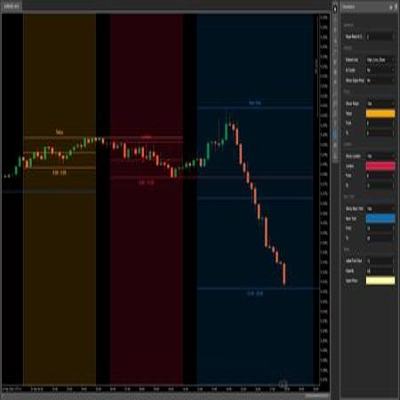
该指标 不生成任何图表输出。它仅以表格形式显示统计分析和指标——没有线条、信号或价格叠加。这些指标衡量并量化价格行为和市场行为的质量与特征,帮助您理解走势是在发生后是决定性的、耗尽的、受争议的还是犹豫不决的——事后。
__________________________________________________________________________________________
一览
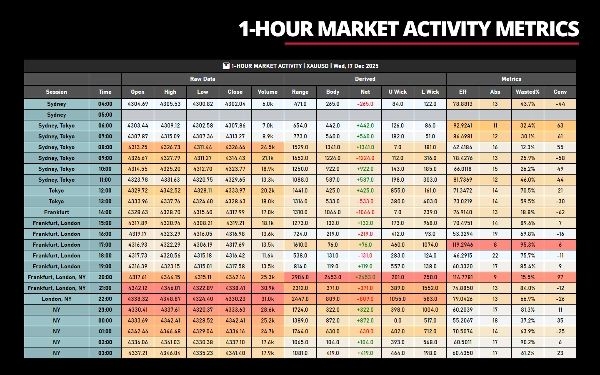
输出: 统计数据(无图表绘制)
显示: 表格格式
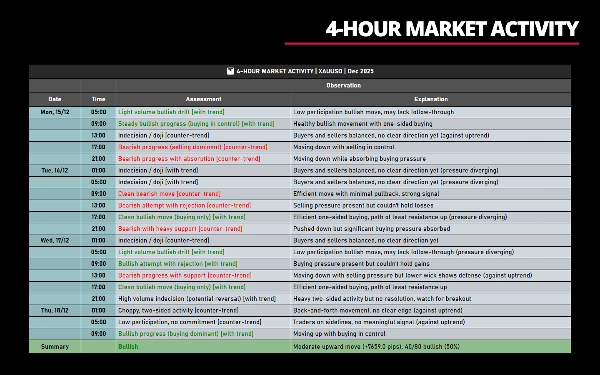
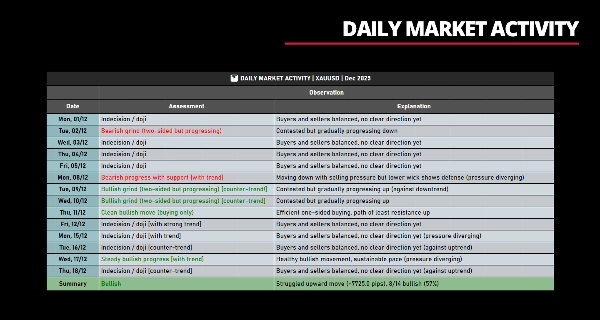
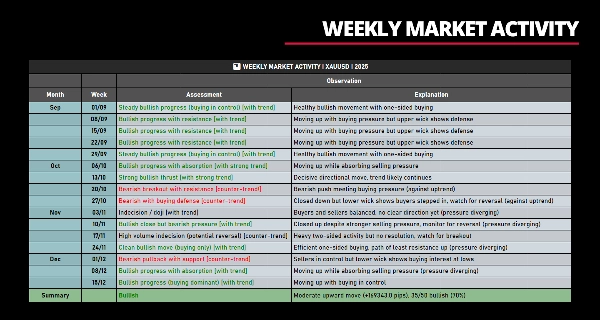
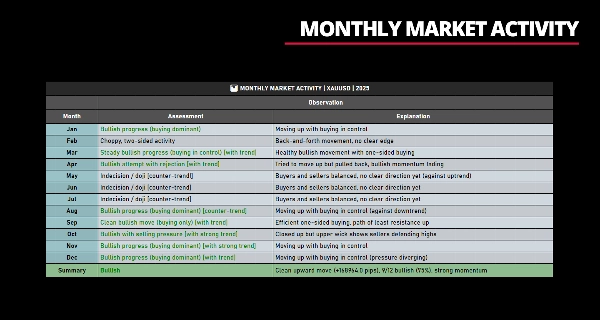
时间框架: 从日内到月度
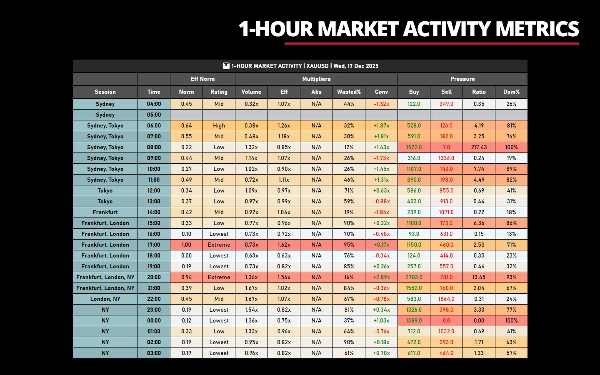
指标: 20多个效率/压力指标
最佳用途: 成交量分析,质量评估
__________________________________________________________________________________________
核心概念:努力与结果
基本前提很简单:
- 努力 = 交易量(交易活动)
- 结果 = 价格变动(区间、实体、净变化)
高效市场 以合理的成交量产生显著的价格变动——走势干净且果断。
低效市场 显示高成交量但净进展有限——走势波动、受争议或被吸收。
通过测量单根柱和汇总周期中的这种关系,您可以识别:
- 趋势与震荡状态
- 承诺与犹豫
- 耗尽与延续
- 单边市场与双边市场
__________________________________________________________________________________________
关键参数配置
这五个参数控制 指标显示哪些数据。理解它们的工作原理对于有效使用至关重要。
1. 日期参数
目的:定义要分析的日期/周期。
格式示例:
""(空)– 最近有数据的交易日"18/12/2025"– 特定日期(DD/MM/YYYY)"12/2025"– 整个月(MM/YYYY)"2025"– 整年(YYYY)
2. 时间范围参数
目的:筛选在日内时间框架中显示的 小时。
适用范围:仅限日内时间框架(1分钟至1小时)
格式示例:
""(空)– 全天24小时交易"8-16"– 上午8点至下午4点"08:00-16:30"– 上午8点至下午4点30分"14"– 下午2点至当前时间
3. 周范围参数
目的:筛选要显示的 当月周数。
适用范围:仅限多小时时间框架(2小时至12小时)
格式示例:
""(空)– 当月所有周"1"– 仅第一周"1,3"– 第1和第3周"2,3,4"– 第2、第3和第4周
4. 月范围参数
目的:筛选要显示的 当年月份。
适用范围:仅限周线时间框架
格式示例:
""(空)– 当年所有月份"1"– 仅1月"1,6,12"– 1月、6月、12月"3,4,5,9,10,11"– 第一季度(春季)和第四季度(秋季)
5. 最大数据行参数
目的:限制表格中显示的行数(柱数)。
适用范围:所有时间框架
默认值:24
格式:
-1或0– 显示所有可用数据(无限制)- 任何正数 – 显示最多该数量的行
__________________________________________________________________________________________
功能特点
灵活性
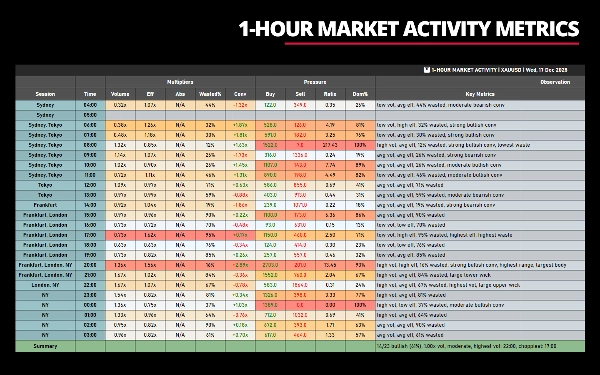
- 8个列组:切换原始数据、派生指标、效率标准化、乘数、压力、关键观察、关键指标的可见性
- 多时间框架:适用于日内(1分钟至1小时)、多小时(2小时至12小时)、日线、周线和月线图表
- 过滤功能:时间范围过滤(例如,“8:00-16:00”)、周过滤(例如,“1,3”)、月过滤(例如,“1,6,12”)
- 最大行数:限制显示最近N个周期或围绕形成中的柱
- 颜色高亮:基于选定指标的任意列组的可选渐变高亮
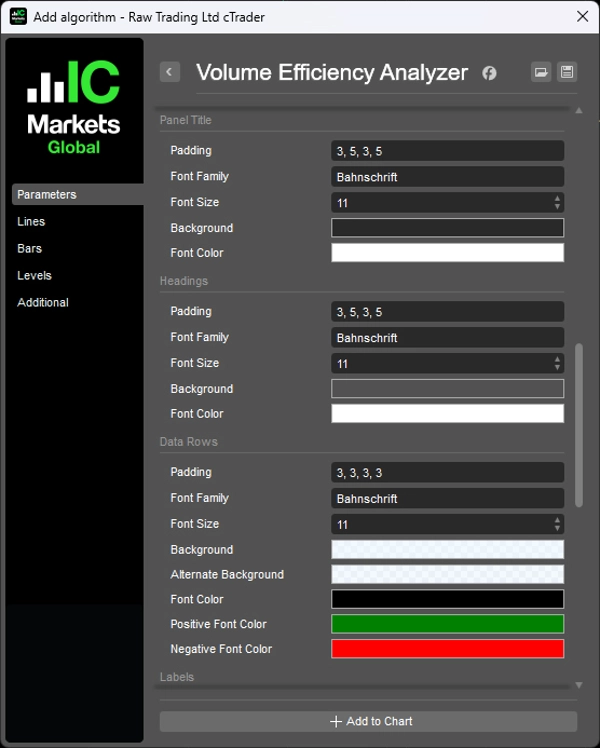
- 可定制样式:完全控制字体、颜色、内边距、列宽
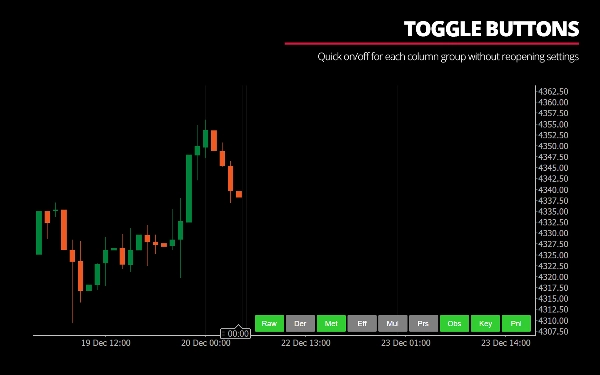
- 切换按钮:无需重新打开设置即可快速开关各列组
时区支持
- 调整经纪服务器时间与本地时间的差异
- 可配置的交易时段开始时间(悉尼、东京、法兰克福、伦敦、纽约)
- 按小时的交易日开始(例如,亚洲时段交易者的凌晨4点)
性能优化
- 使用二分查找实现高效的柱查找
- 单遍计算最小/最大值以支持高亮显示
- 实时更新限流500毫秒以防止延迟
- 搜索提示以避免重复查找
__________________________________________________________________________________________
理解指标
什么是 良好 的走势?
- 高效率:以较少的成交量走了很远
- 低浪费%:极少的影线,干净的方向性实体
- 压力一致:多头收盘时买方压力占优(反之亦然)
- 强烈信念:高度方向性承诺
什么是 差劲 的走势?
- 低效率:需要大量成交量才能推动一点
- 高浪费%:大影线,微小实体(震荡)
- 压力矛盾:多头收盘但卖方压力占优
- 信念薄弱:尽管有成交量,但无方向性承诺
“吸收”是什么意思?
当价格尽管成交量高却难以移动时,市场正在“吸收”该成交量。这表明:
- 高吸收:存在阻力/支撑,价格难以移动
- 低吸收:移动轻松,阻力小
示例解读:
“强劲的多头推进(买方占优)”
- 高成交量 + 高效率 + 低浪费 + 多头净值 + 买方压力占优
“高成交量犹豫(潜在反转)”
- 高成交量 + 极端浪费 + 微小实体 + 压力平衡
“多头收盘但空头压力存在”
- 收盘上涨但卖压超过买压(背离,潜在陷阱)
“参与度低,无承诺”
- 低成交量 + 平均效率 + 无明显压力主导
__________________________________________________________________________________________
优势与好处
1. 量化直觉
- 如果你曾感觉“这看起来很震荡”或“这波走势很弱”,该指标能量化这些观察
- 为主观评估提供客观指标
2. 多维分析
- 大多数工具显示成交量或价格模式。本工具显示它们的关系
- 结合成交量、价格结构、方向偏好和压力动态于一视图
3. 语境感知
- 单根柱评估考虑趋势语境
- 区分“上涨趋势中的盘整”与“下跌趋势中的盘整”
- 标记可能是陷阱的逆势走势
4. 教育性
- 自然语言解读帮助你学习市场动态
- 随着时间推移,你将开始无需指标即可识别效率模式
5. 多用途应用
- 趋势交易者:识别趋势强劲与耗尽时机
- 震荡交易者:发现高浪费盘整区
- 突破交易者:检测高成交量的决定性突破与假突破
- 成交量交易者:在成交量实现的背景下观察
6. 无延迟
- 所有计算基于已完成的柱(或当前形成的柱)
- 无平滑处理,无移动平均,无重绘
__________________________________________________________________________________________
挑战与顾虑
使用本指标前,请了解以下重要事项:
此指标并非适合所有人:
1. 高复杂度
- 8个列组中有20多个指标
- 需要理解成交量分析、价格行为和市场微观结构
- 学习曲线陡峭——预计观察1-2周后模式才清晰
2. 信息过载
- 默认“显示全部”视图令人不知所措
- 必须自定义以匹配你的交易重点
- 尝试同时使用所有指标可能导致决策瘫痪
3. 不是交易系统
- 该指标不告诉你何时买卖
- 它告诉你市场在做什么,而不是你应该做什么
- 你必须将其与自己的进出场规则结合使用
4. 需要解读
- “高成交量犹豫”可能意味着突破前或耗尽
- “高效多头走势”不保证延续
- 你需要指标之外的市场语境
5. 成交量限制
- 外汇使用交易量(成交笔数),非真实成交量
- 低流动性品种可能显示效率读数不稳定
- 新闻事件可能导致成交量激增,暂时扭曲指标
6. 低时间框架表现
- 在1分钟图上显示100+根柱时,界面可能感觉迟缓
- 柱数越多,每次更新计算越多
- 建议:使用≥5分钟图进行实时监控
7. 无警报
- 目前不生成特定条件的警报
- 你必须手动监控显示内容
8. 主观阈值
- “高”成交量定义为 1.25倍 平均值——这是我的个人阈值
- “极端”浪费为≥80%——同样是主观定义
- 你可能不同意这些定义,但它们是硬编码的
__________________________________________________________________________________________
工作原理
1. 数据收集
- 定义分析周期(日期/时间范围)
- 对周期内每根柱,收集图表柱的OHLCV数据
- 计算每根柱的派生和效率指标
- 汇总指标以建立平均值和极值
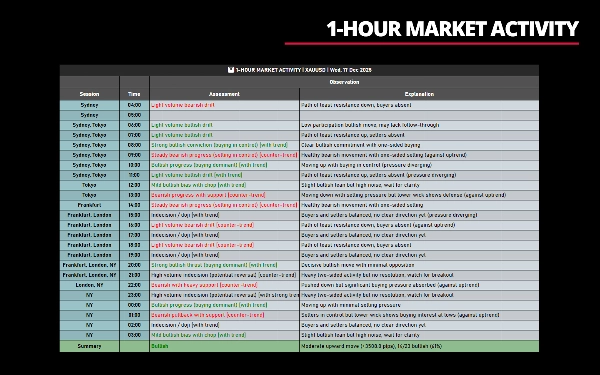
2. 解读逻辑
自然语言评估遵循基于优先级的决策矩阵:
优先级1:犹豫模式
- 极端浪费%(≥80%)或微小实体伴随高影线 → 十字星/拒绝信号
- 高成交量 + 极端浪费 → 潜在耗尽
优先级2:高成交量场景
- 高成交量 + 高效率 + 低浪费 → 决定性推进
- 高成交量 + 高效率 + 高浪费 → 有阻力的突破
- 高成交量 + 低效率 + 高浪费 → 吸收/受争议走势
优先级3:效率驱动信号
- 无论成交量高低,高效率 → 干净/高效走势
- 低效率 → 漂移、磨盘或弱走势
优先级4:成交量水平回退
- 低成交量 → 漂移,无承诺
- 平均成交量 → 通过信念、实体百分比、浪费水平评估
3. 精细调整:
- 压力分析检测矛盾(例如,“多头收盘但卖压占优”)
- 影线分析识别拒绝(多头柱上的上影线 = 卖方守住高点)
- 趋势语境添加“[随趋势]”或“[逆趋势]”标记
4. 汇总计算
- 统计多头与空头柱数
- 计算方向效率(多头走势与空头走势)
- 测量吸收比率(双方面临的阻力大小)
- 计算累计净变动和趋势语境
- 生成结合计数、幅度和趋势方向的统一偏向
__________________________________________________________________________________________
技术说明
计算方法
- 使用 累计柱分析 在每个周期内
- 汇总所有子柱的成交量、影线、实体
- 从累计数据计算净方向偏向
- 比简单的OHLC分析更准确
归一化
- 效率相对于可见数据集中的最小/最大值归一化
- 确保评级在语境上适当
- 评级尺度:极端(80-100%)→ 高(60-80%)→ 中(40-60%)→ 低(20-40%)→ 最低(0-20%)
趋势语境
- 计算所有前期的累计净点数
- 识别连续的方向性周期
- 比较近期与之前的效率和压力
- 标签:“上涨趋势(强)”、“下跌趋势(弱)”、“震荡”
__________________________________________________________________________________________
最终说明
该指标基于这样一个信念构建: 理解市场质量比预测方向更有价值。
它不是问“价格会涨吗?”,而是问:
- “这波走势质量高吗?”
- “买卖双方是挣扎还是高效?”
- “这次突破是可持续的还是弱的?”
- “当前动态是协调还是背离?”
通过关注 质量而非预测,交易者可以:
- 避免低概率的交易设置
- 在有承诺的走势中入场
- 当努力超过结果时退出
- 了解何时应回避(低质量环境)
如果你重视透明度、教育和理解 为什么 价格会这样变动,该指标可能对你有价值。
如果你偏好简单和快速信号,其他工具可能更适合你。
__________________________________________________________________________________________
更多免费指标
探索各种市场分析工具——从结构和成交量到回归、波动率和自定义时间框架。
源代码可在GitHub 仓库获取。
全部免费使用。但如果你想支持咖啡,可以通过 这里捐赠。
支撑/阻力
成交量
移动平均线
实用工具/自定义
基于回归
波动率
振荡器
__________________________________________________________________________________________
免责声明
交易存在风险。该指标仅用于技术分析——请始终应用适当的风险管理并负责任地交易。
反馈与改进
如果您有建议、功能请求或改进想法,请在讨论标签页留言。您的反馈有助于为所有人改进该指标。
摘要
Key features include customizable column groups, color highlighting, and time zone adjustments for various trading sessions. The indicator quantifies market conditions by identifying efficient versus inefficient moves, absorption levels, and directional pressure, helping traders distinguish between decisive, exhausted, or indecisive price actions after they occur. It incorporates trend context and natural language interpretations to aid understanding of market dynamics.
Volume Efficiency Analyzer does not generate buy/sell signals or alerts; it is intended to complement traders’ own strategies by providing objective metrics that quantify market quality rather than predict direction. It requires familiarity with volume analysis and market microstructure due to its complexity and information density. The indicator is suitable for trend, range, breakout, and volume-focused traders seeking a comprehensive, multi-dimensional view of market behavior.
客户评价
5 | 100 % | |
4 | 0 % | |
3 | 0 % | |
2 | 0 % | |
1 | 0 % |