"Advanced Market Structure  Bos,Choch,SwinLevels, Order Blog" logo
Advanced Market Structure Bos,Choch,SwinLevels, Order Blog
0.0
13/08/2025
1
Desktop

🚀 10,000+ traders already use our TOP indicators🏆

Discover why professionals choose us – the most powerful tools on cTrader (indicators, algorithms, and cBots) are waiting for you.

👉 Get all our TOP systems here:

_______________________________________________

_______________________________________________

📌 Market Structure Indicators

·     ✅ AdvancedMarket Structure: Bos, Choch, SwinLevels, Order Blocks,  Market Structure& Liquidity Finder

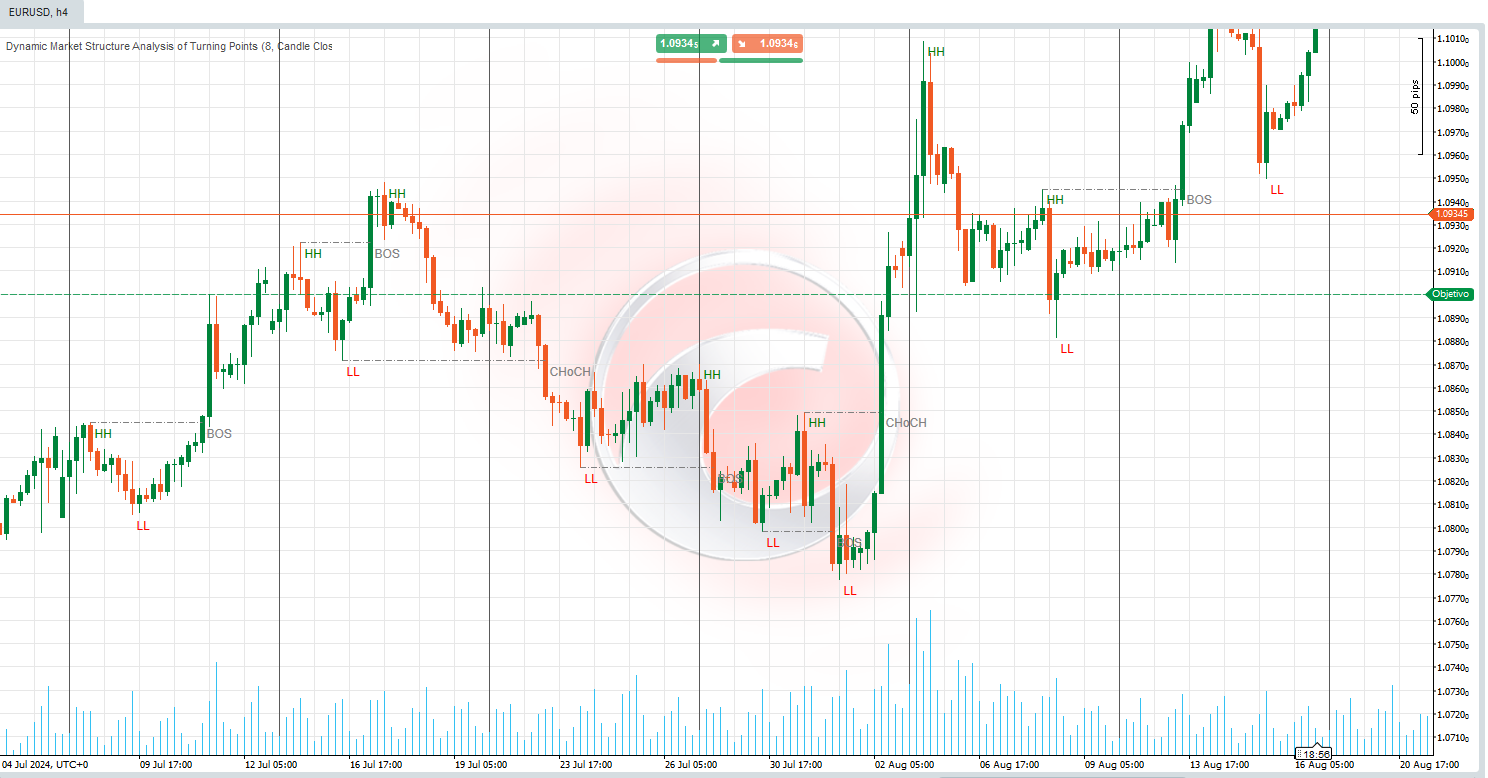
·     🔄 Dynamic Market StructureAnalysis of Turning Points

·     🧱 Order Block

·     ⚖️ Market Imbalance

·     ⛓️ BOS & CHOCH

·     🧠 ICT Power of 3

·     🌀 Market Polarity Zones

______________________________________________________________-

Store cBots :  🧠 Gold & BTC BreakoutSession Pivots 🧠

_______________________________________________

🔚 Smart Exit Systems
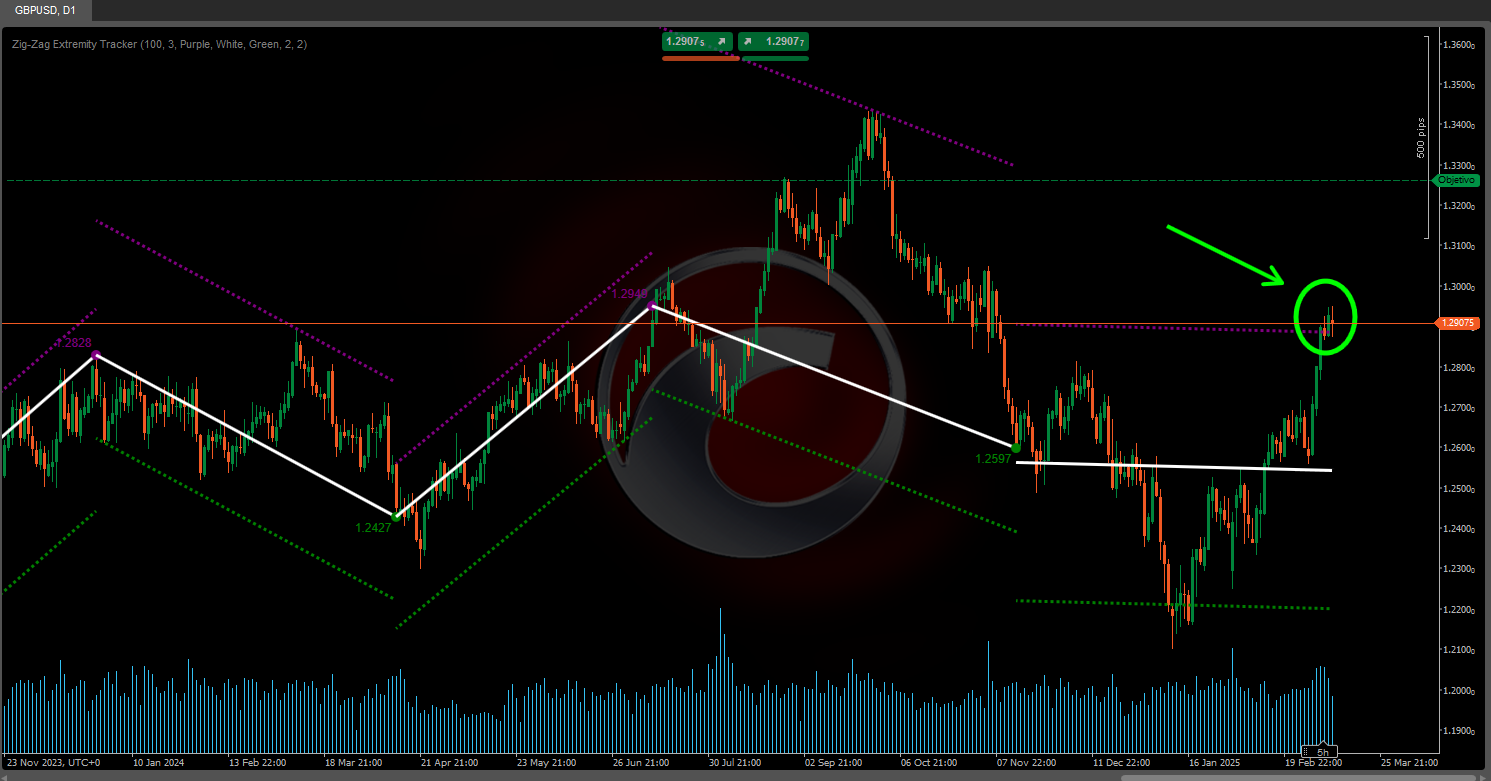
·     📍 Trailing Smart Algorithm

_______________________________________________

📐 ZigZag Indicators

·     🔍 ZigZag Price LiquidityProjection

·     🧭 S&R Structural ZigZag

·     ➖ ZigZag

·     🎯 Zig-Zag Extremity Tracker

_______________________________________________

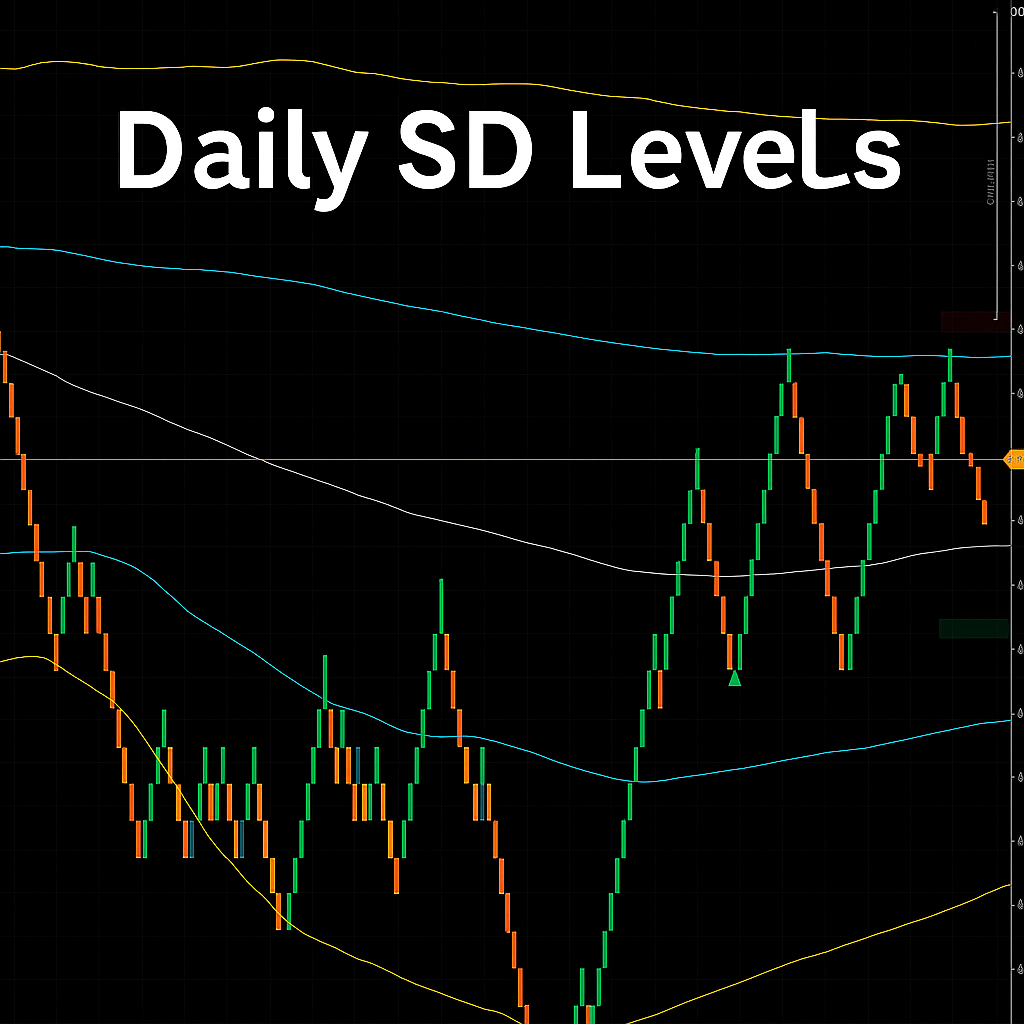
🧱 Support & Resistance Indicators

·     🟩 SmartTrend Support &Resistance Lines

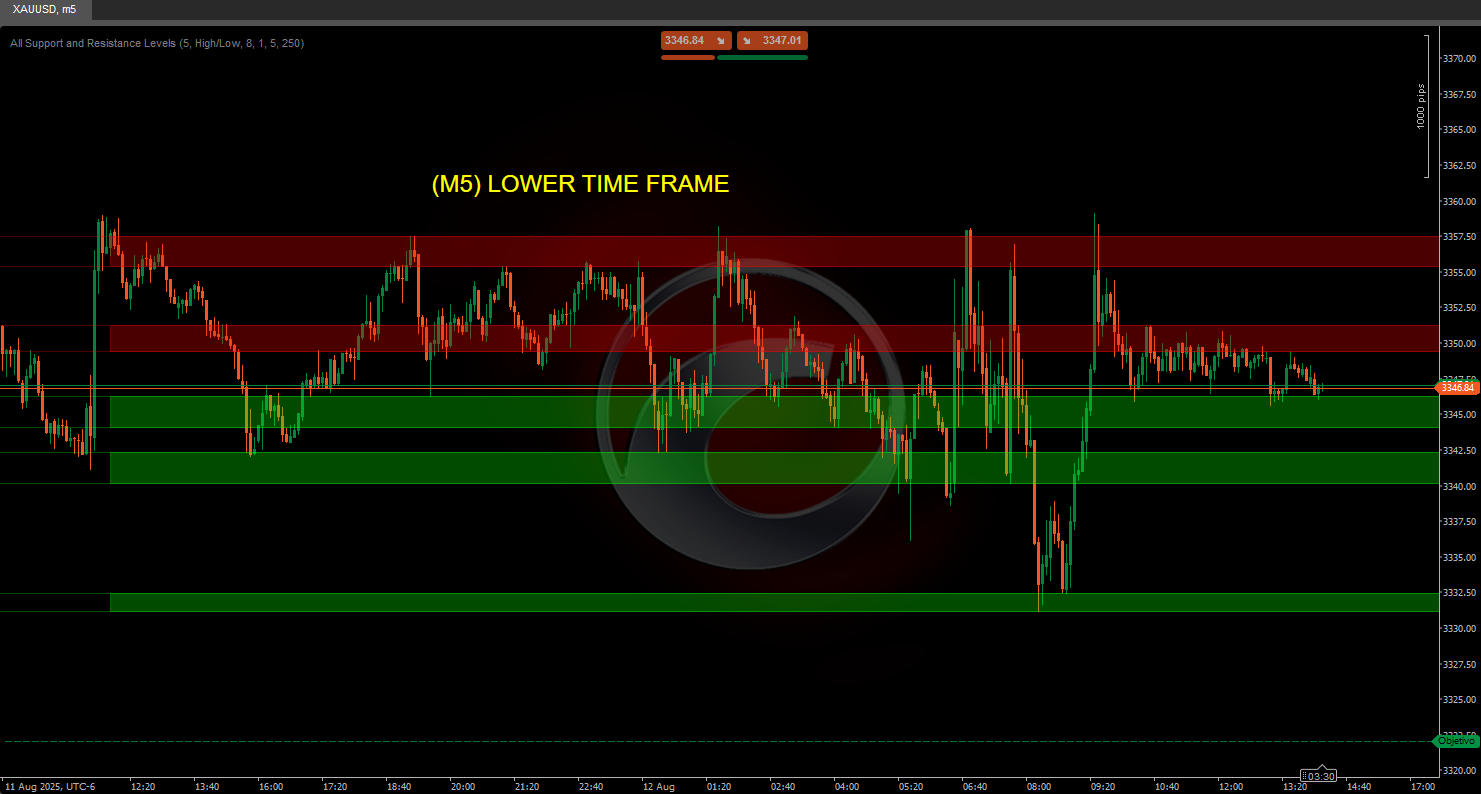
·     🧱 All Support and ResistanceLevels

_______________________________________________

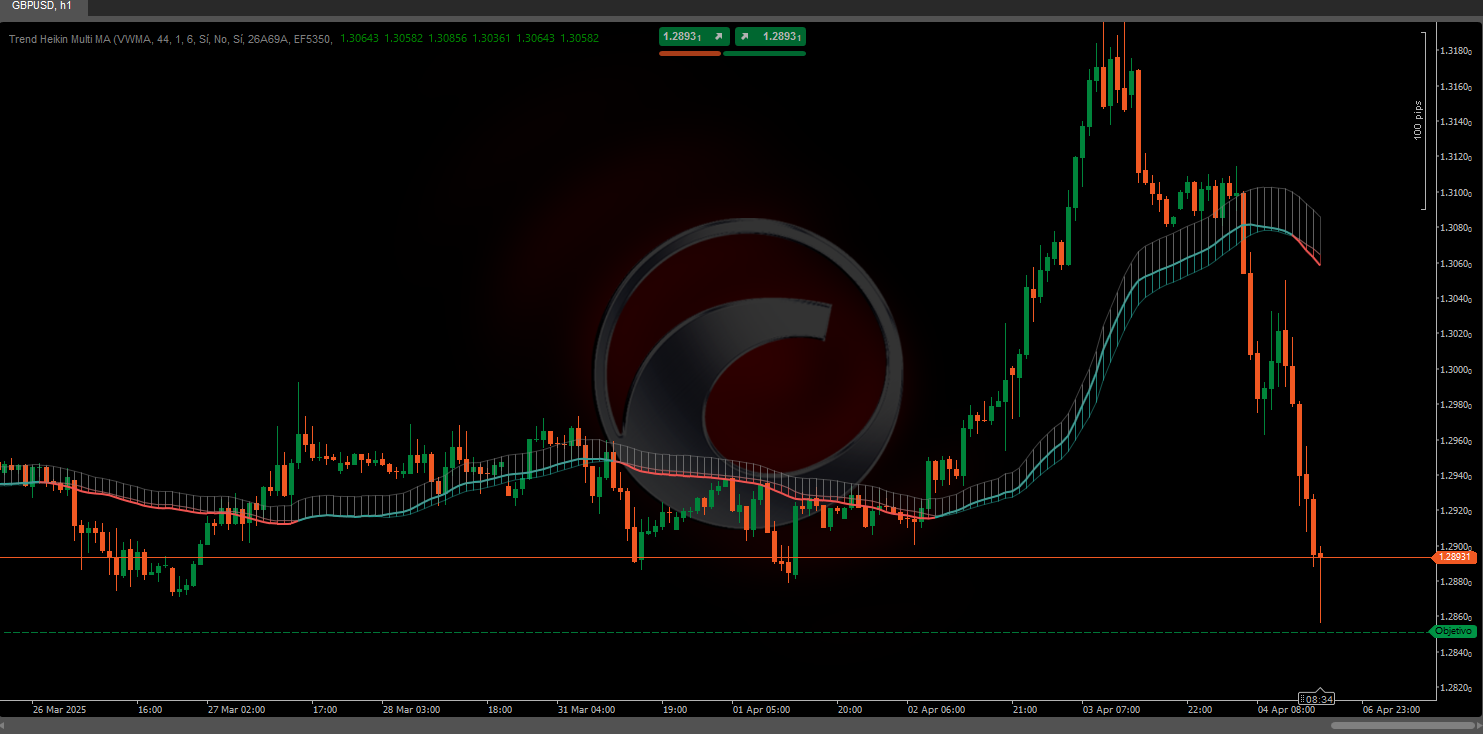
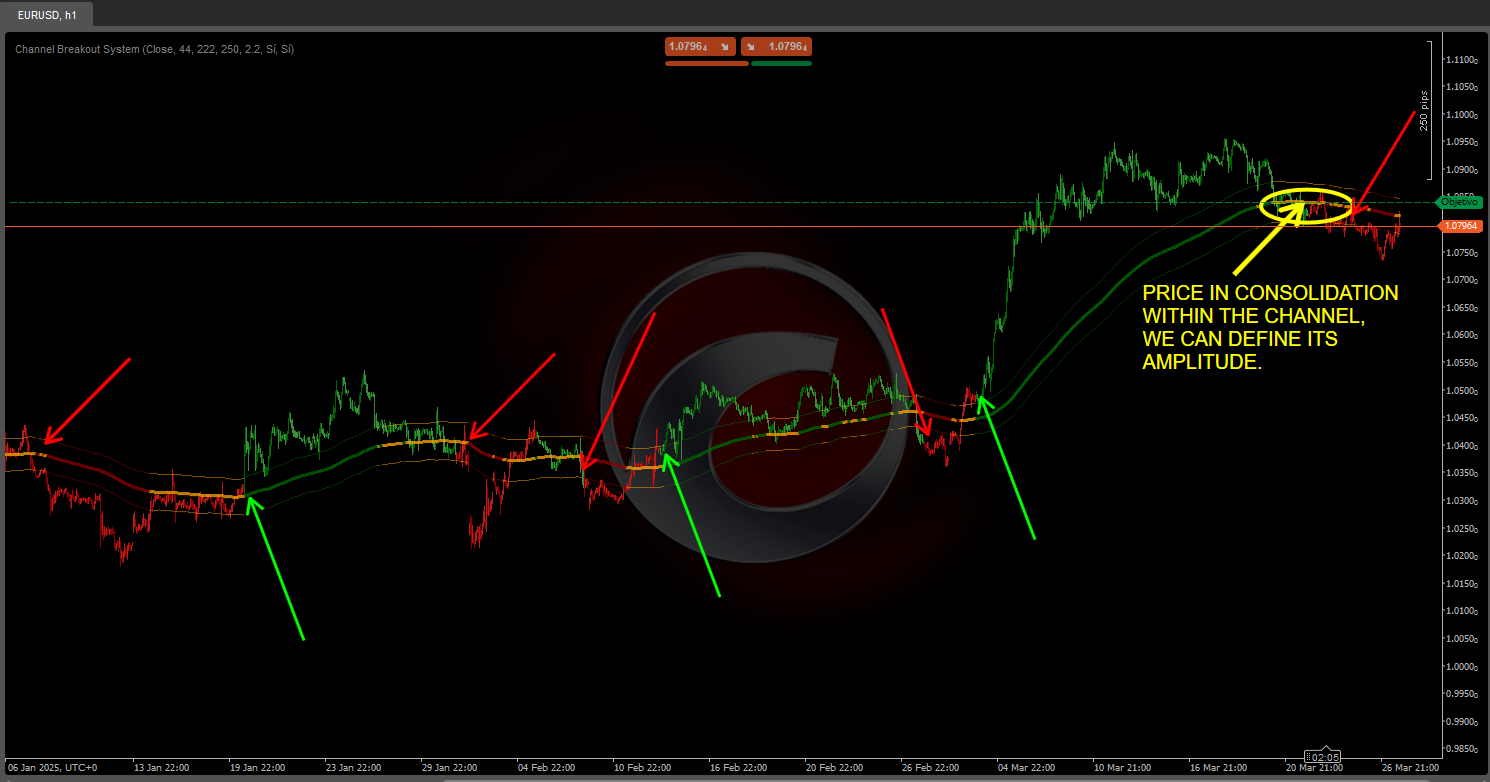
📊 Trend & Channel Indicators

·     🔄 Auto-Trend Channel

·     📊 Supertrend

·     ⚡Momentum Trend Analyzer

·     🧠 Adaptive Trend Channel

·     💥 Channel Breakout System

·     🌈 Dynamic Trend Gradient

·     ⭐ PREMIUM SSL CHANNEL

·     🔁 Reactive Moving Average

_______________________________________________

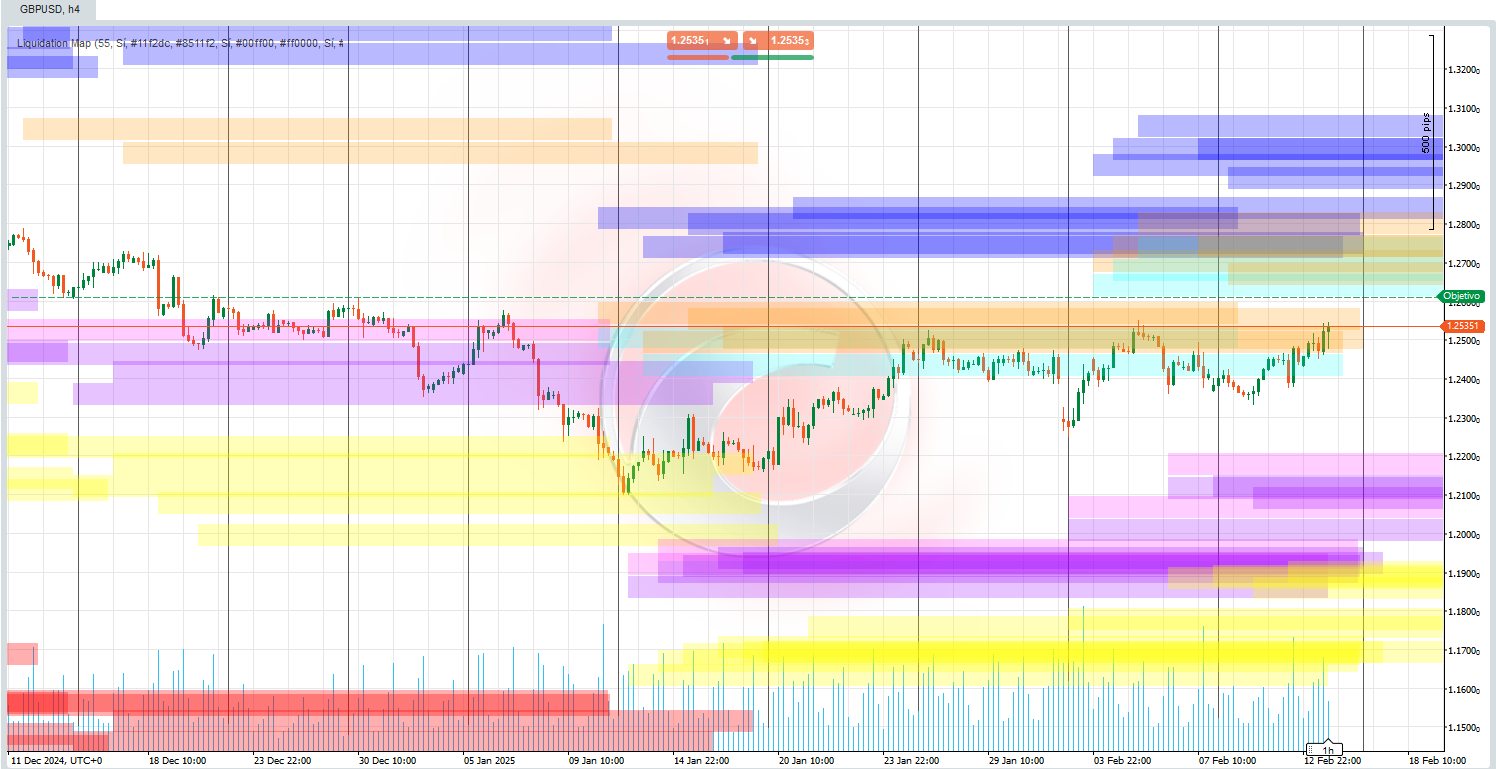
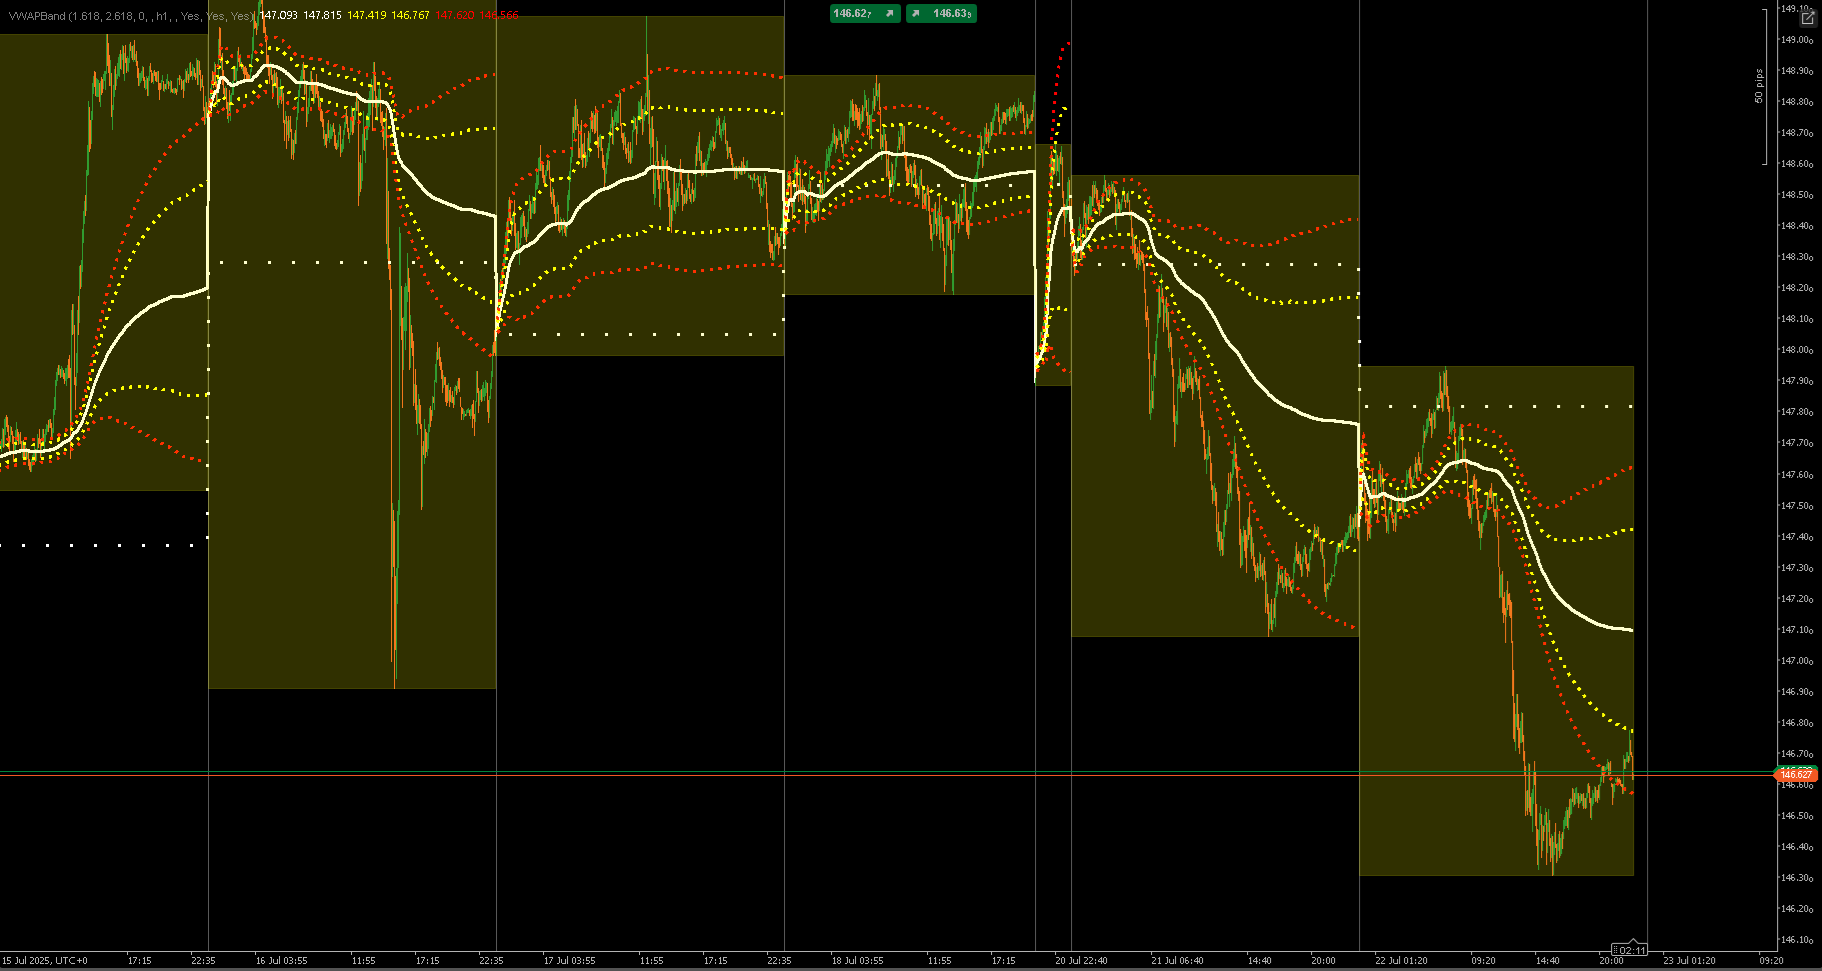
💧 Volume & Liquidity Tools
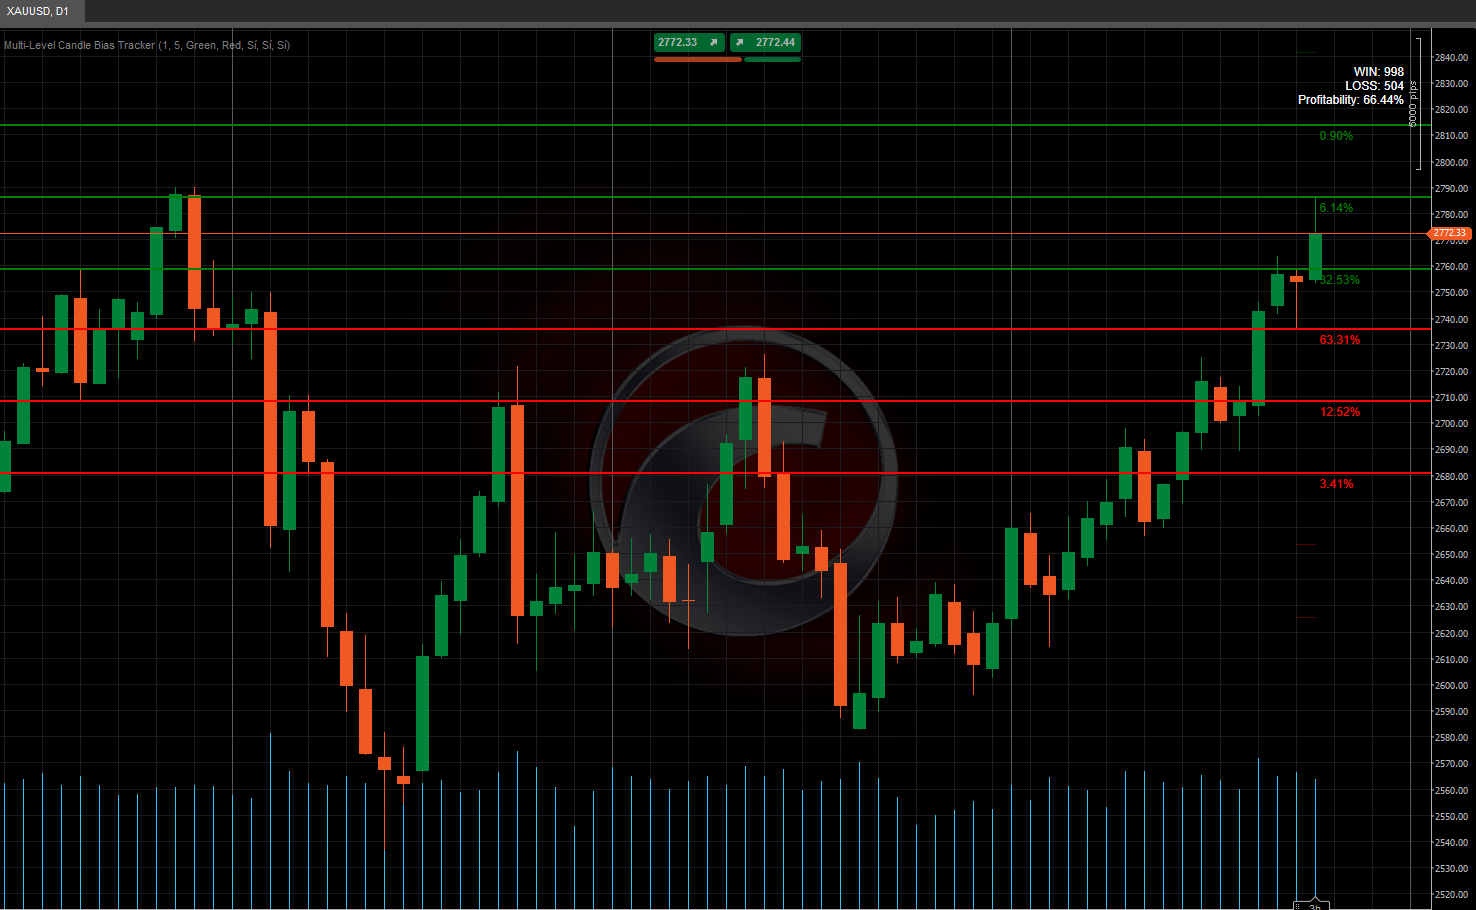
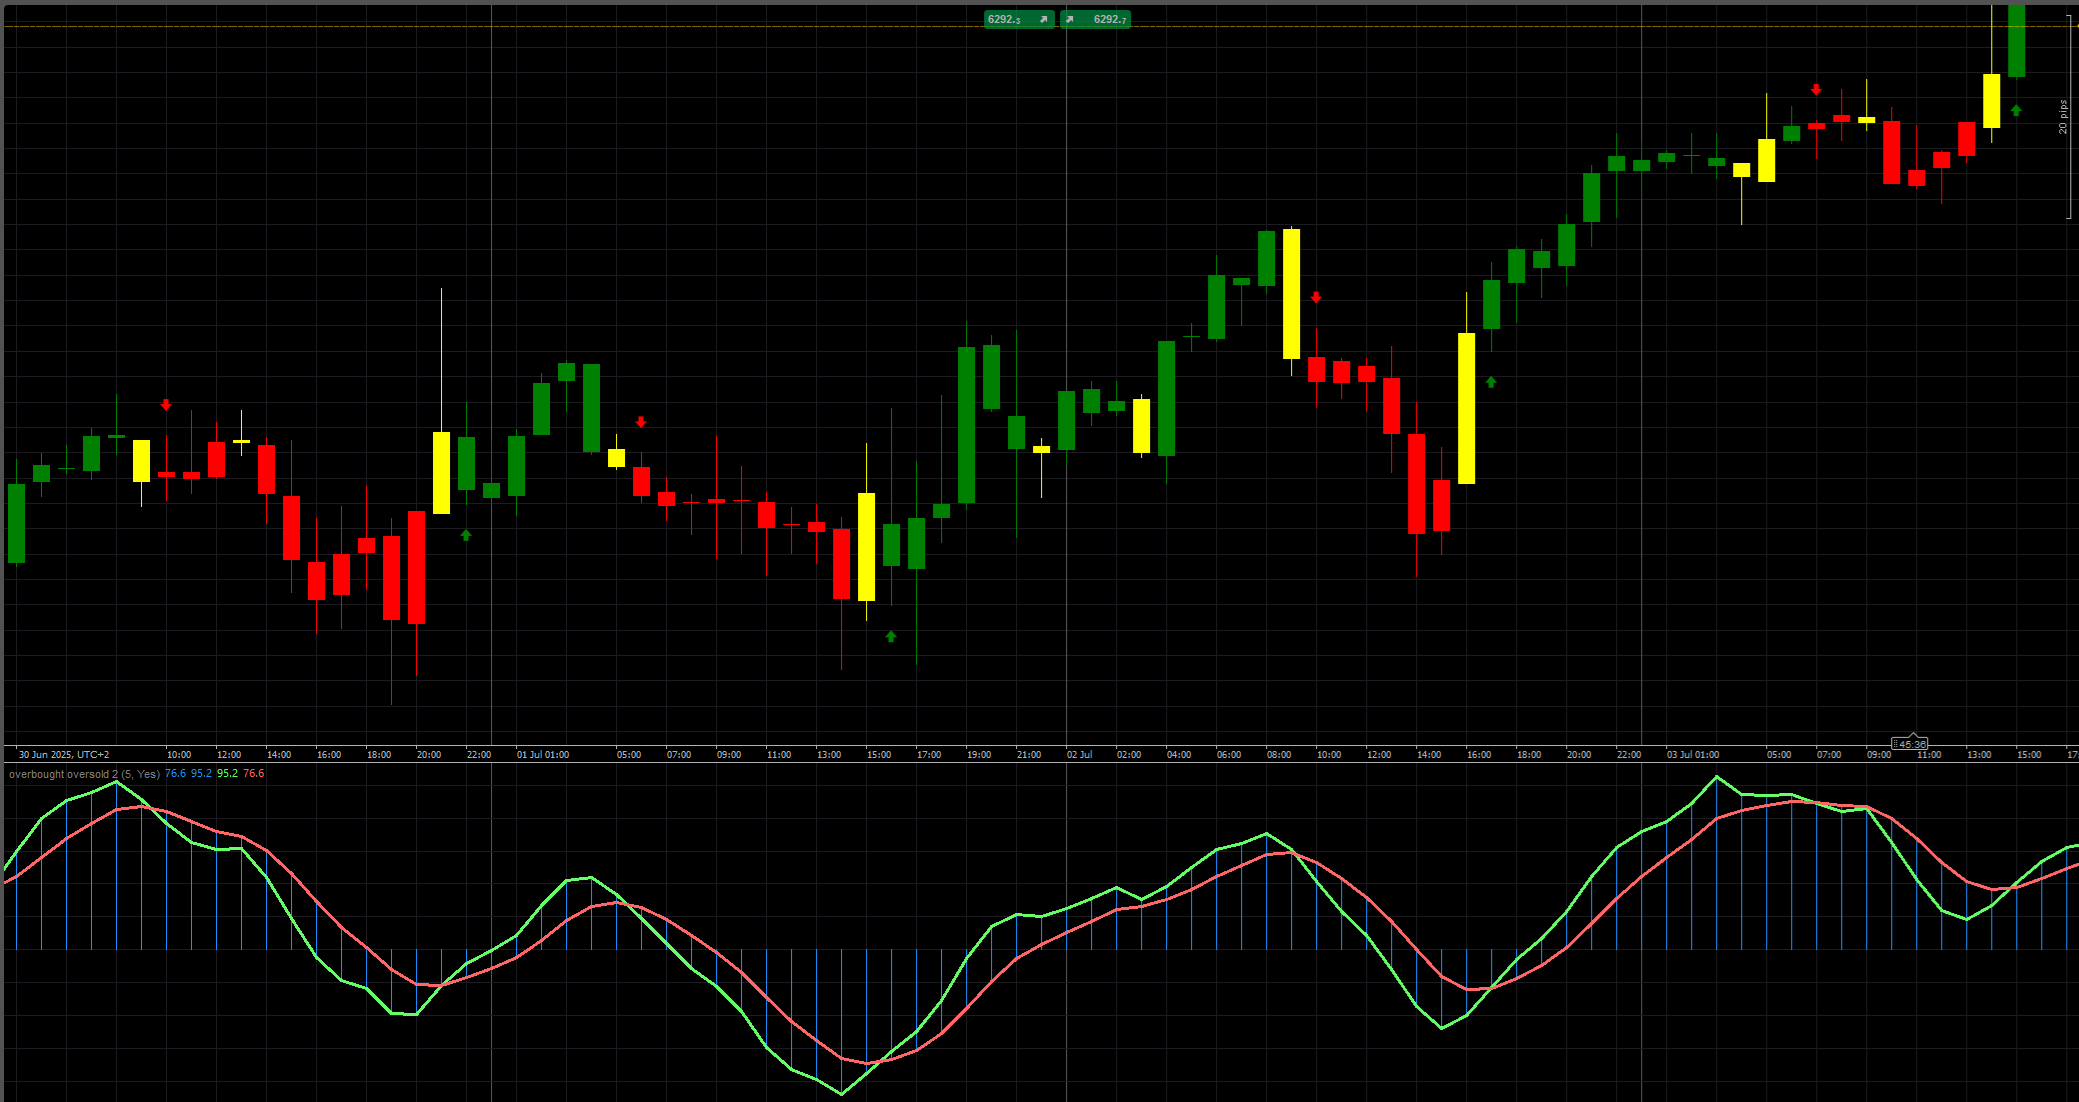
·     🔥 Volume POC Heatmap

·     📉 Leverage Liquidation Map

·     🔍 Momentum Fair Value Gap

·     🕒 Fair Value Gap Sessions

_______________________________________________

Momentum & RSI Indicators

·     📈 RSI Trend Trigger

·     🚀 Dynamic Range Momentum

·     🔎 Multi-Level Candle BiasTracker

_______________________________________________

🔮 Prediction & Projection Tools

·     📐 Prediction Based on Linreg& ATR

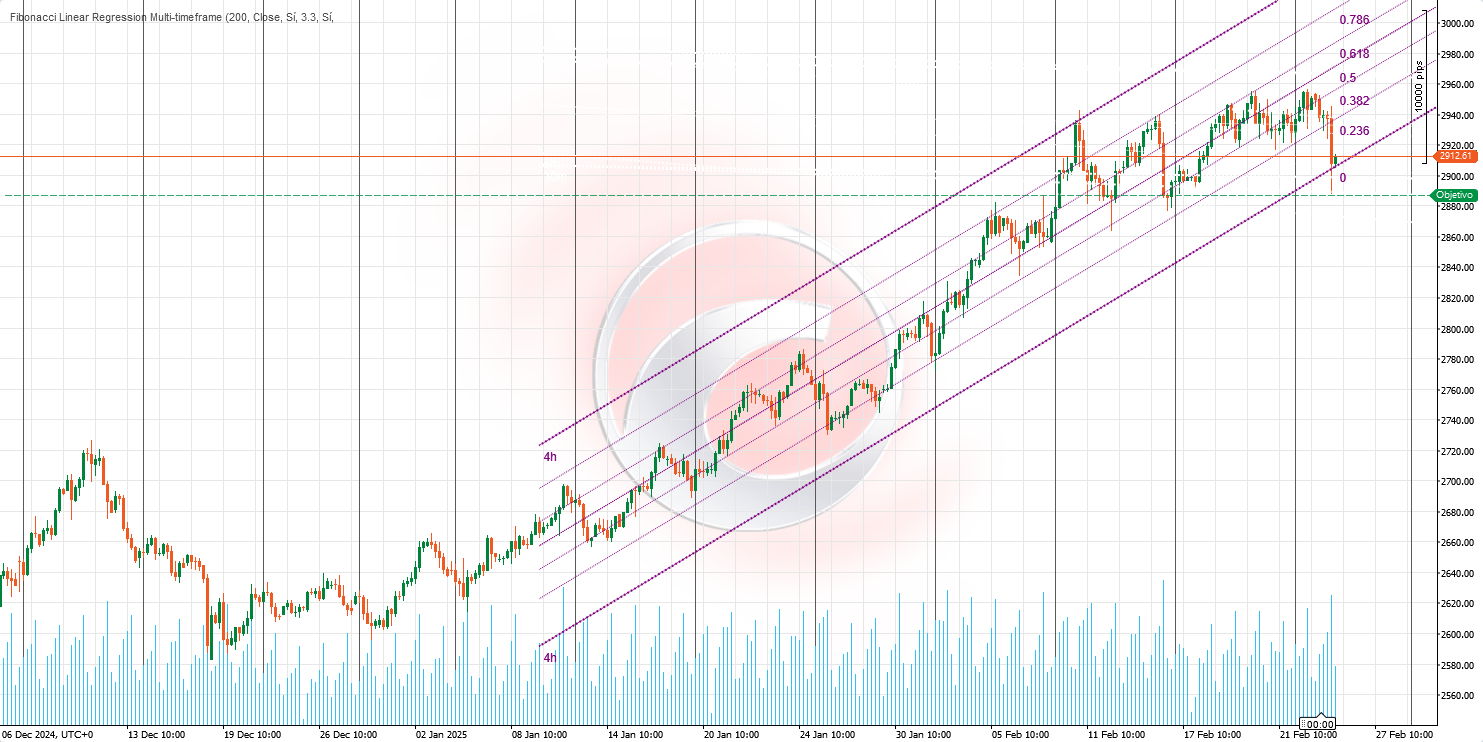
·     📏 Fibonacci Linear RegressionMulti-timeframe

·     📈 Volume-Powered Market Flow Projector 

  📉 Fibonacci Pitchfan


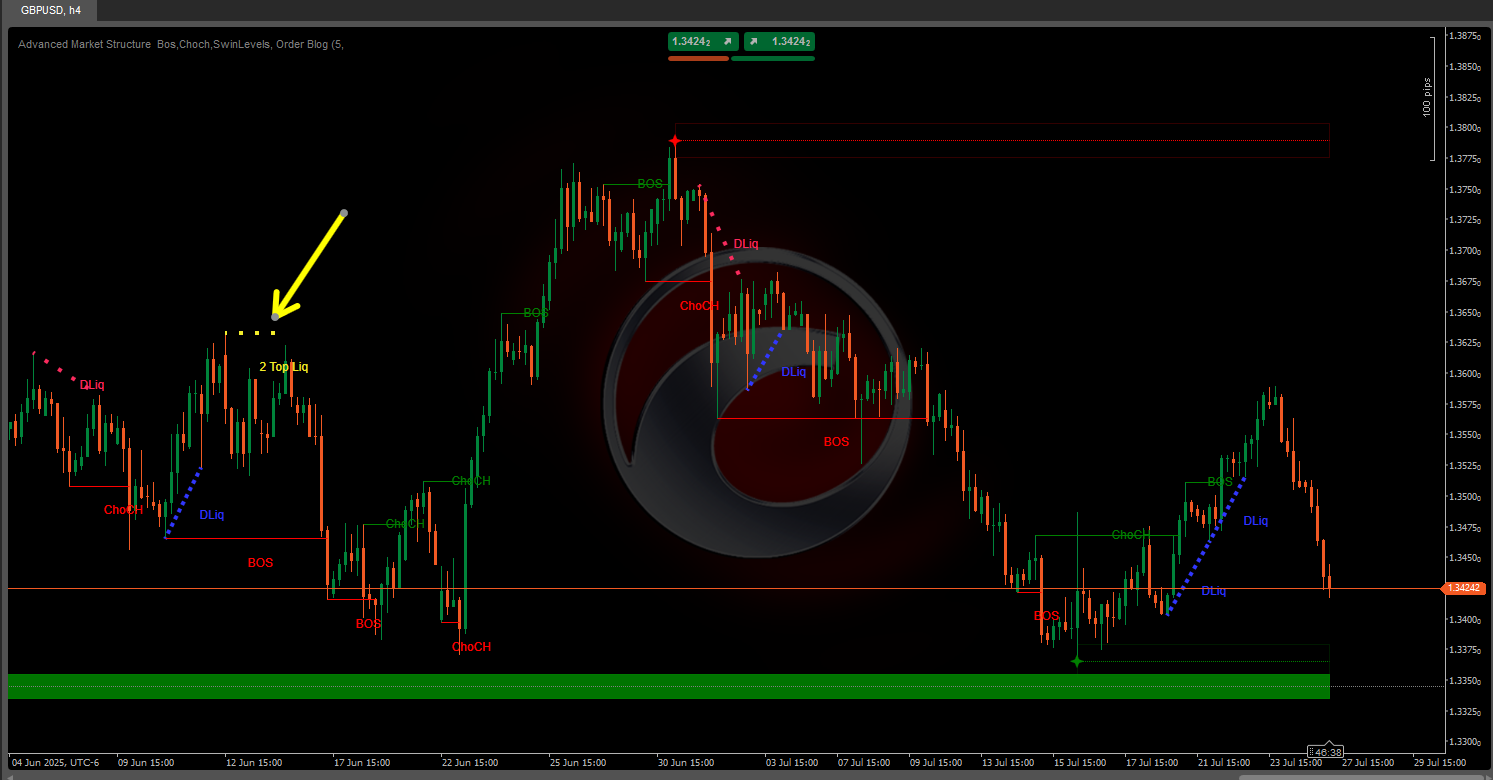
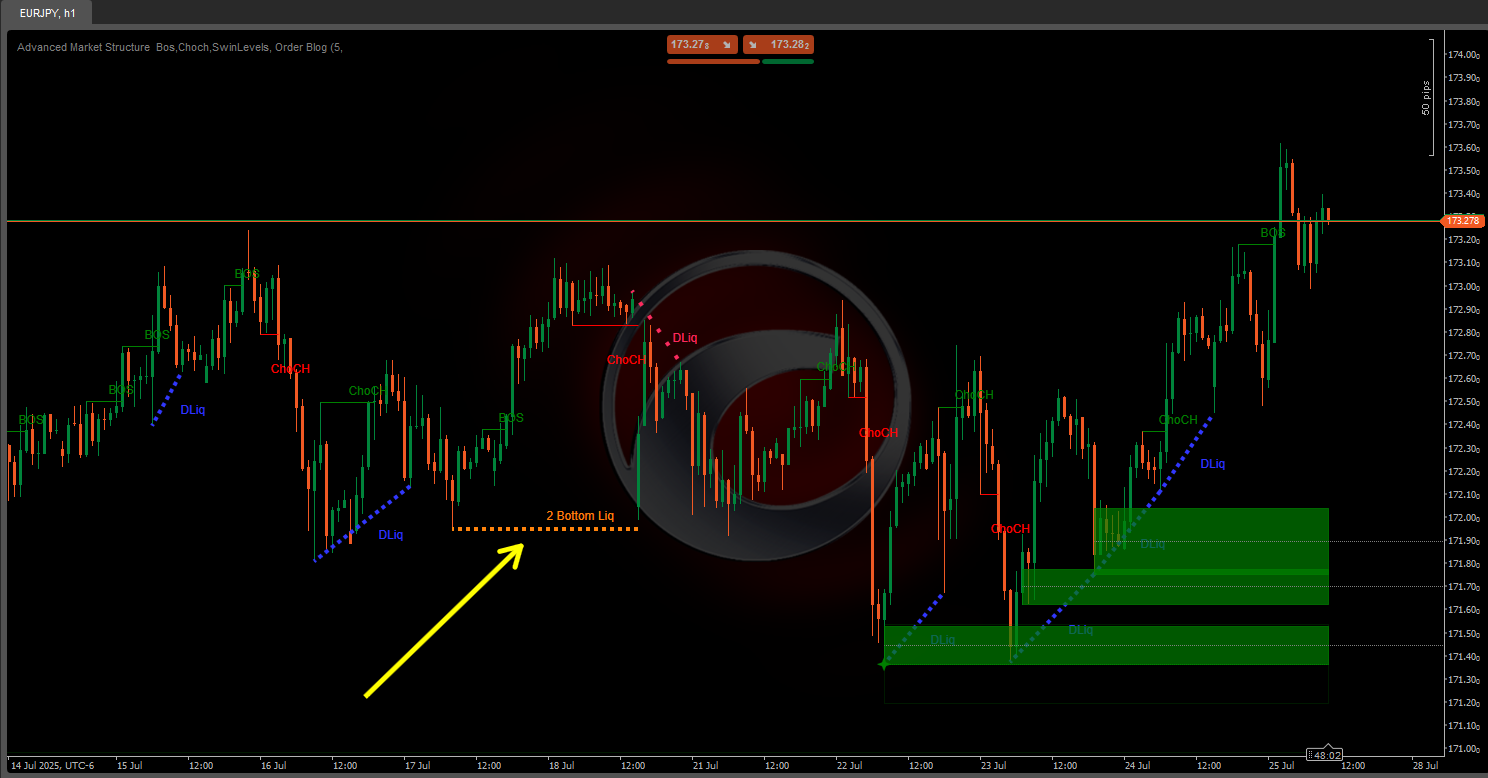
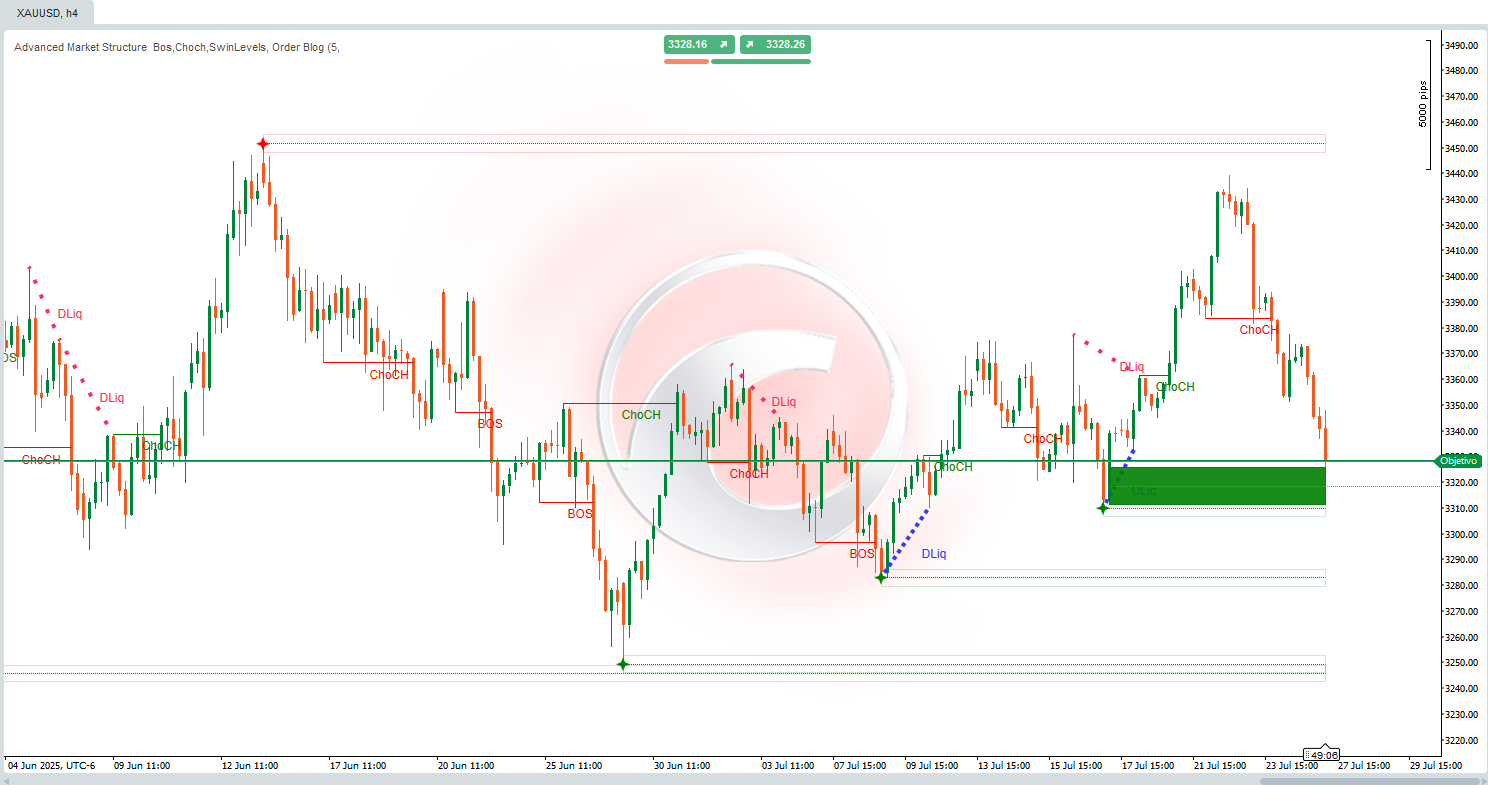
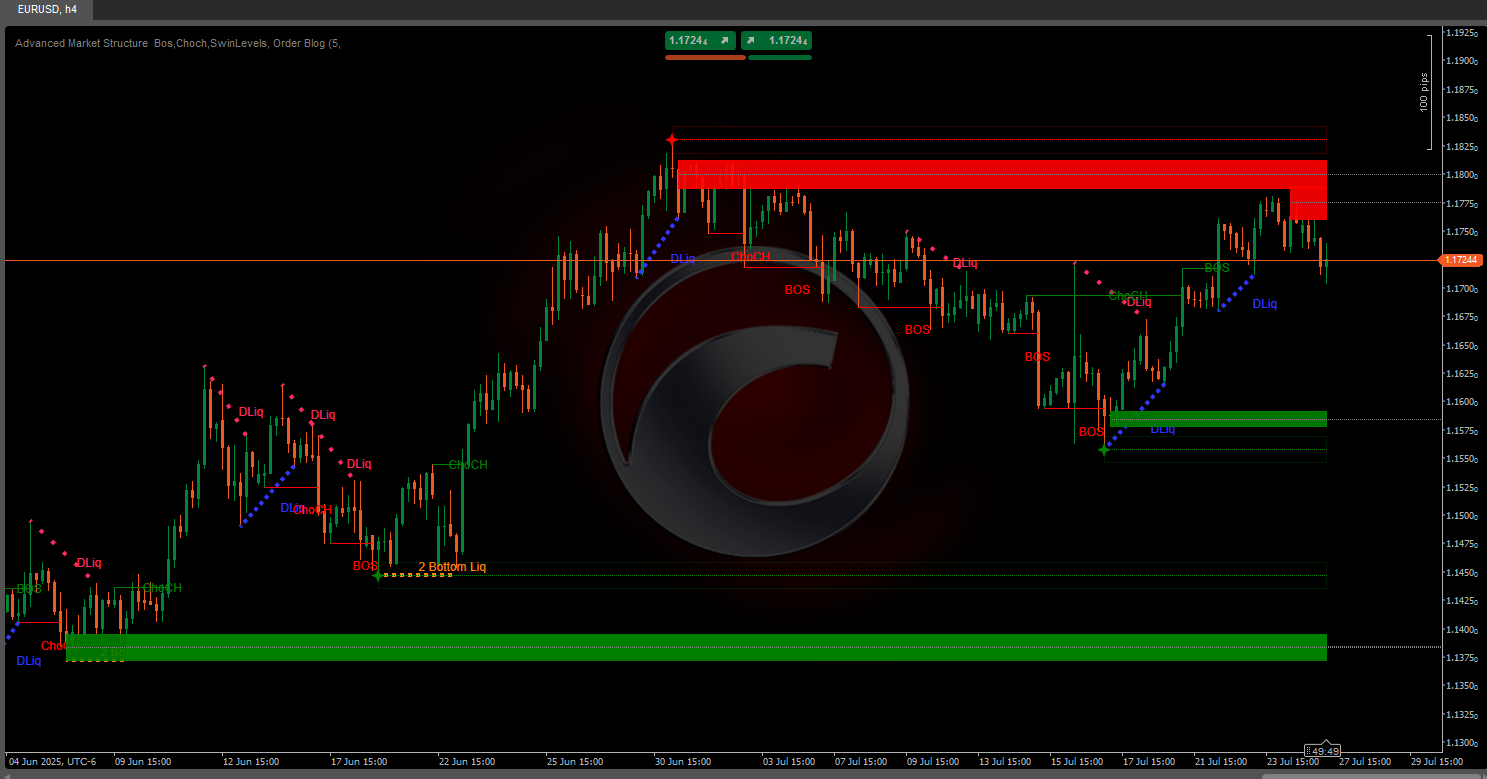
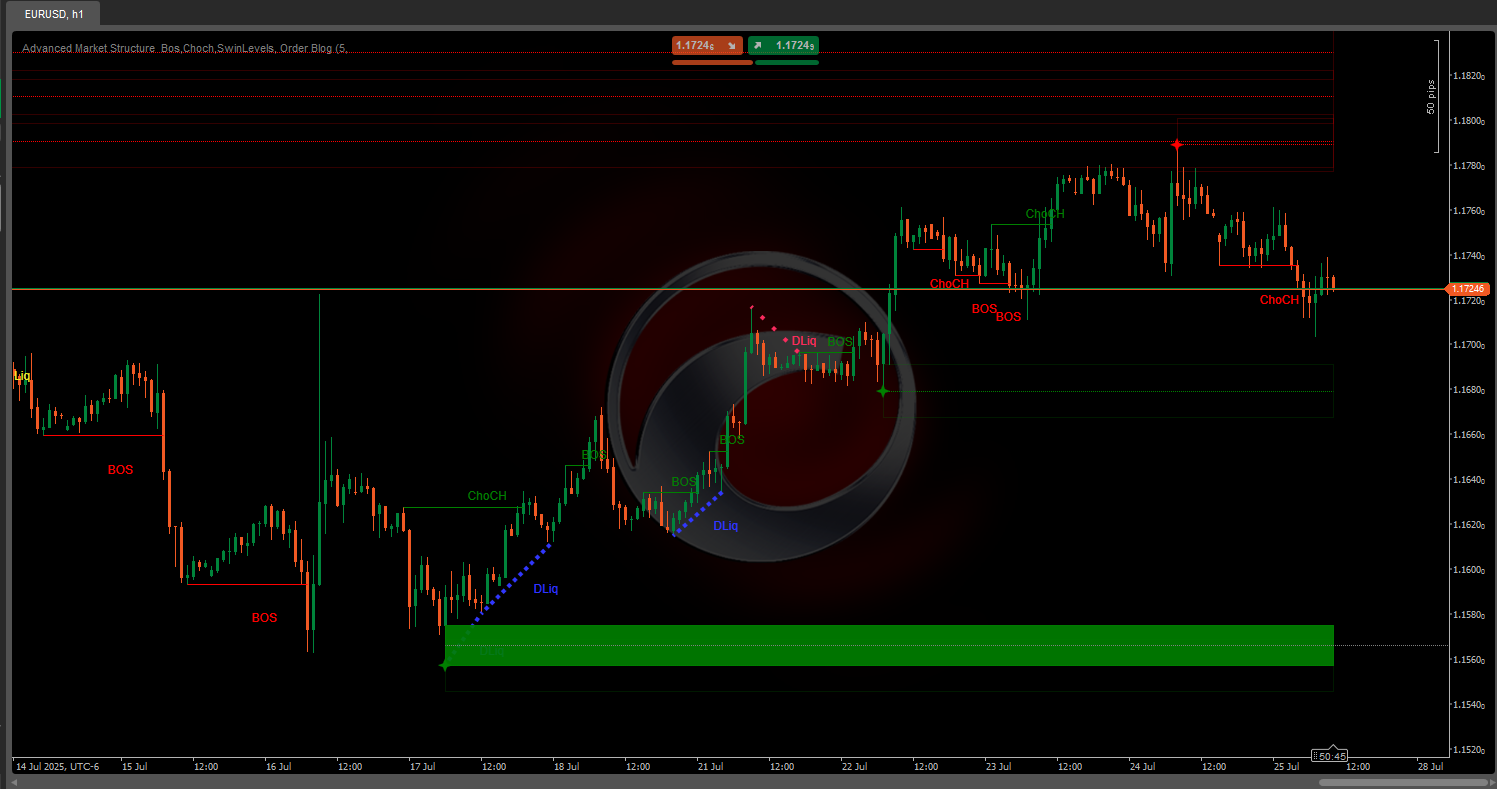
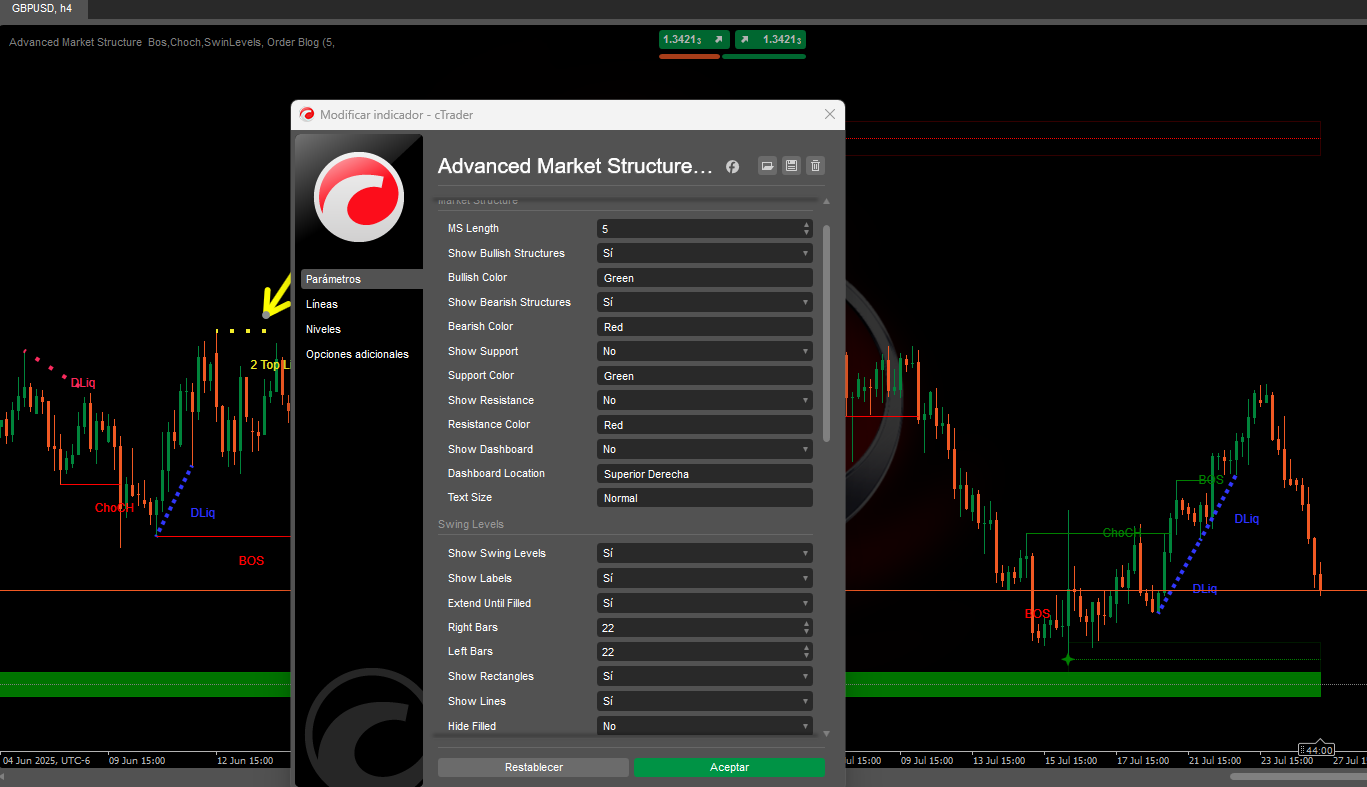
Advanced Market Structure: Bos, Choch, SwinLevels, Order Blocks,  Market Structure & Liquidity Finder.

What Is It?

An advanced price action tool that combines multiple technical analysis concepts into one powerful indicator. Integrates:

  • 📊 Market Structure
  • 🔄 Swing Levels
  • 🧱 Order Blocks
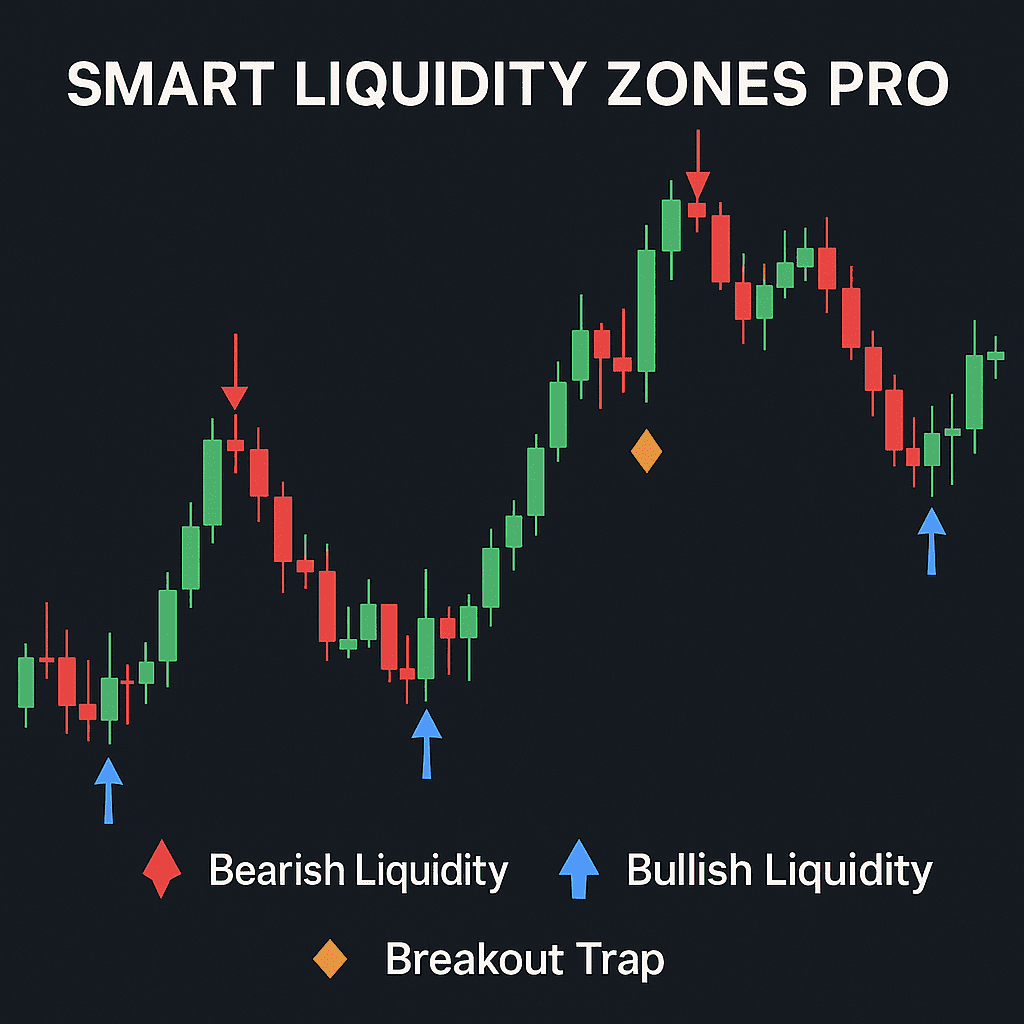
  • 💧 Liquidity Finder (2 Bottoms & 2 Tops)

Goal: Identify key entry/exit points, trends, support/resistance, and institutional zones where price reacts.

🧠 Core Philosophy: Smart Money

Markets are driven by institutional players (banks, funds, market makers) with superior resources. They create patterns to:

  • 🕵️‍♂️ Hide operations during accumulation/distribution.
  • 🎯 Hunt liquidity (retail stop losses).
  • 🚀 Fuel explosive moves in unbalanced markets.

🔑 Components:

1. Order Blocks

  • What: Zones where institutions executed massive orders, creating imbalances.
  • Types:
    • 🟢 Bullish (Demand): Aggressive institutional buying.
    • 🔴 Bearish (Supply): Aggressive institutional selling.
  • Key Signal: Price rebounding/reversing at order blocks.
  • Detection:
    • Volume spikes near highs (bearish) or lows (bullish).

2. Swing Levels

  • Purpose: Define market structure through key highs/lows.
  • Critical Breaks:
    • 🔺 Swing High Break: Bullish continuation.
    • 🔻 Swing Low Break: Bearish continuation.

3. Break of Structure (BoS)

  • Definition: Decisive break of swing highs (bullish) or lows (bearish).
  • Fractal Connection:
    • 🐂 Bullish Fractal: 5-candle pattern with central lowest low.
    • 🐻 Bearish Fractal: 5-candle pattern with central highest high.

4. Change of Character (ChoCh)

  • Definition: Structural shift signaling trend reversal.
  • Triggers:
    • Breaking swing lows in uptrends (bearish ChoCh).
    • Breaking swing highs in downtrends (bullish ChoCh).

5. Liquidity Zones

  • Types:
    • ⚖️ Static: Horizontal levels with clustered highs/lows (ATR-filtered).
    • 🏃 Dynamic: Trendlines connecting steep pivots.
  • Key Patterns:
    • 🕯️ 2 Tops/2 Bottoms: Institutional stop hunts.
    • ⛰️ Triple Tops/Bottoms: High-congestion zones.

🎯 Key Applications

  • ✅ Identify trends/reversals via BoS/ChoCh.
  • 📍 Locate support/resistance using swing levels & liquidity zones.
  • 🏦 Spot institutional order blocks.
  • 🎯 Predict price targets through liquidity zones.

🔄 Smart Money Strategies

PhaseSignalsInstitutional Action

1. Accumulation

ChoCh bullish + Demand order block 📈

Smart Money buys

2. Markup

Consecutive BoS + FVG gaps 🚀

Retail fuels momentum

3. Distribution

ChoCh bearish at 2 Top Liquidity 🎯

Smart Money sells

4. Markdown

Bearish BoS + Discount zone liquidation 🔻

Stop hunts at lows

⚙️ Parameter Tuning Guide

Market Structure

  • MS Length:
    • ⬆️ Increase: Fewer but more reliable fractals.
    • ⬇️ Decrease: More sensitive (risk of noise).

Swing Levels

  • SwingSizeL/R:
    • ⬆️ Increase: Identifies significant swings.
    • ⬇️ Decrease: Catches minor reversals.
  • Extend Until Filled:
    • ✅ Enabled: Levels persist until price hits them.

Order Blocks

  • Mitigation Method:
    • ✨ Wick: Faster signals (touches wick).
    • 🎯 Close: Stronger signals (closes outside block).

Liquidity Finder

  • Static/Dynamic Sensitivity:
    • ⬆️ Increase: Fewer zones (higher quality).
    • ⬇️ Decrease: More zones (higher sensitivity).
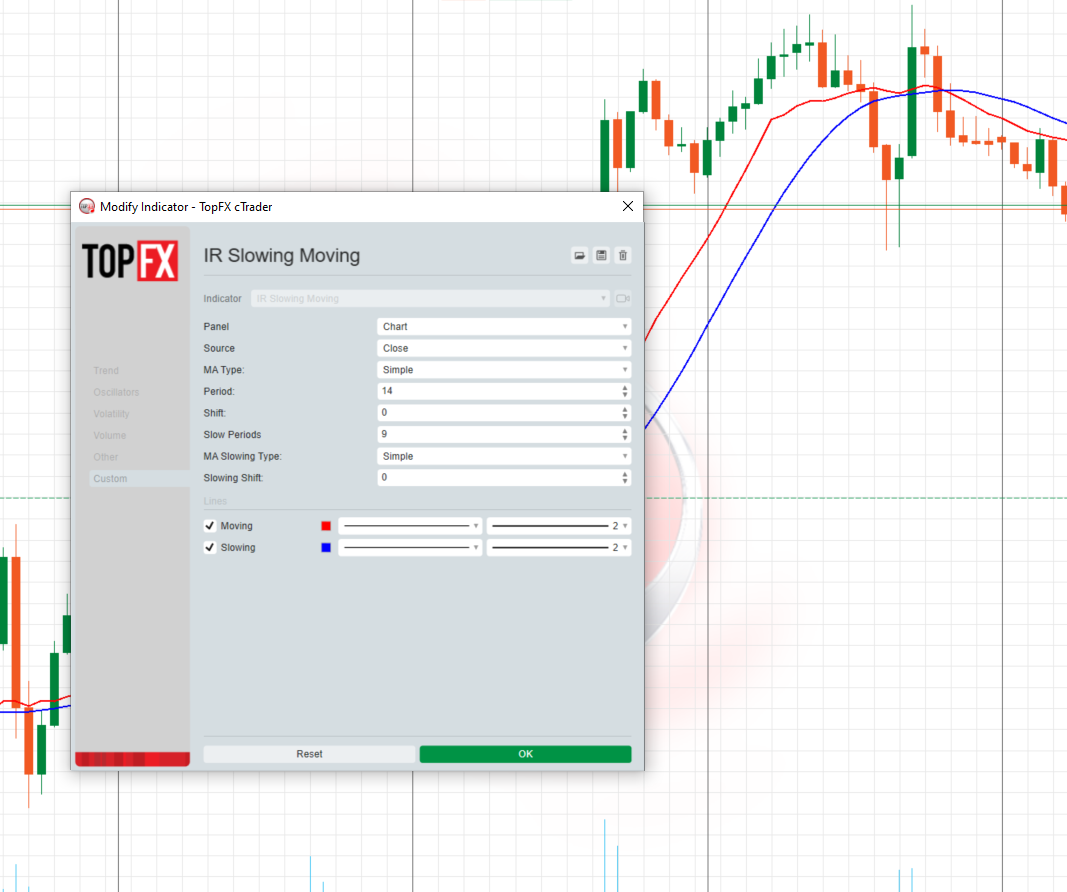


More from this author
Indicator
breakout
btcusd
supertrend
+6
ZigZag
ZigZag filters noise, spots trends, patterns, pivots, aiding analysis, trade management, and confirmations. 📉📈
Indicator
breakout
btcusd
supertrend
+6
Order Block
Identify bullish and bearish Order Blocks to spot key support/resistance levels and potential trend reversals! 📈🔄
Indicator
breakout
btcusd
supertrend
+5
Auto-Trend Channel
Adaptive trend channel using linear regression and Pearson correlation for dynamic support, resistance, and trends.
Indicator
breakout
btcusd
supertrend
+5
BOS & CHOCH
Market structural patterns , specifically the concepts of Change of Character (ChoCH) 🔄 and Break of Structure (BoS) 💥
Indicator
breakout
btcusd
supertrend
+5
Zones Supply Demand
📊Zones Supply & Demand: Identifies key price levels with high volume concentration, marking Supply/Demand Zones & Marke
Indicator
breakout
btcusd
supertrend
+5
Supertrend
💹 Define a price channel 📈 and determine trend direction (bullish 🟢 or bearish 🔴).
Indicator
breakout
btcusd
supertrend
+6
Volume POC Heatmap
📊 Shows volume by price levels, highlights POC, and key zones. Identifies dynamic support/resistance and imbalances.
Indicator
breakout
supertrend
rsi
All Support and Resistance Levels
"Identify key market zones and visualize support/resistance from multiple timeframes on a single chart.
Indicator
breakout
btcusd
supertrend
+6
Fair Value Gap Sessions
identify and highlight temporary market inefficiencies known as "fair value gaps" 🚨 within specific trading Sessions.
Indicator
breakout
btcusd
supertrend
+4
Dynamic Market Structure Analysis of Turning Points
Identify market structure effortlessly with swing highs, lows, CHoCH, and BOS levels for smart trading decisions! 📊🔍"
Indicator
breakout
indices
btcusd
+7
RSI Divergence
Detects bullish and bearish divergences
Indicator
breakout
supertrend
rsi
Trend Heikin Multi MA
🚀 TrendHeikinMultiMA: Advanced trend detection using Heikin-Ashi smoothing & MAs! Eliminates noise, confirms real trend
Indicator
breakout
btcusd
supertrend
+4
Multi-Level Candle Bias Tracker
Price direction by calculating the probability of reaching new highs/lows. Shows levels & stats📈
Indicator
breakout
supertrend
rsi
Leverage Liquidation Map
📊 Liquidation Map: Potential areas where highly leveraged investors might face liquidations.
Indicator
breakout
supertrend
rsi
Market Trend OB
Price action to detect when the market changes trend (MSB) and defines, order blocks , ZigZag etc.📊
Indicator
breakout
supertrend
rsi
Zig-Zag Extremity Tracker
Dynamically adjusts regression channels based on ZigZag extremes, resetting when price breaks bands to track real trends
Indicator
breakout
bollinger
supertrend
+3
Fibonacci Linear Regression Multi-timeframe
Combining Fibonacci levels and regression to analyze multidimensional market trends across multiple timeframes¡
Indicator
breakout
supertrend
rsi
+1
Dynamic Trend Gradient
Identifies trends with moving averages & volatility. Base levels = bullish 🐂 or bearish 🐻 signals. Reversals detected!
You may also like
Indicator
forex
breakout
btcusd
+9
Advanced HTF Trend Buy & Sell Trading System
Detects breakouts 📈 auto-draws levels 🚀 confirms trends 🐻 dynamic signals 🎨 customizable for any asset & timeframe.
Indicator
breakout
PDHL
PDHL - Previous Day High&Low
Order Flow Ticks v2.0
SessionOne
Session One is a tool for marking from to, useful if you've set the hours you want to trade
"STC" logo
5.0
(2)
STC
Schaff Trend Cycle (STC) Indicator
Simple MACD Histogram
Simple MACD Histogram with color-coded rising (green) and falling (red) momentum bars.
Automatic Fibonatti
Automatically plots Fibonacci retracement levels using the highest and lowest points of a customizable time range
Indicator
forex
commodities
atr
+2
LevelMaster SR
LevelMaster S/R: Pinpoint key support & resistance zones with precision. Perfect for traders of all levels Trade smarter
Pivot Point Daily Indicator
Pivot Points Standard — All-in-One Multi-Timeframe Pivot Indicator for cTrader
zh-cn Variety Period time panel(multilanguage)
This indicator can be used to: change color, shape size, position, change font, increase or decrease, and other function
Indicator
breakout
supertrend
rsi
+1
Reactive Moving Average
Combines SMA with dynamic correlation to adapt to market trends. Adjusts sensitivity, filters noise🚀📉
Indicator
supertrend
atr
supertrend
Supertrend Indicator for cTrader
Anchored VWAP by LudwigICT
Anchored VWAP (Auto hi-lo) by LudwigICT
Market Sessions - Free
Track major trading sessions (Tokyo, London, New York) with customizable colors and visual sessions on your chart.
All-in-One Session Levels Suite
Institutional Session Levels Pro OHLC,Prev(D,W,M OHLC)
Goldenhours
The Session Golden Hours indicator is designed for serious traders looking to visualize high-probability
Indicator
breakout
indices
vwap
+4
ProVWAP
Advanced Anchored VWAP for cTrader: volatility bands, real‑time alerts & customizable session resets.
IR Macd on Chart
this indicator show macd on chart.