説明
Pinescriptlabs ストア インジケーター: 🤖Pinescriptlabs ストア cBots:
SmartTrend Support &
Resistance Lines Gold & BTC BreakoutSession Pivots(new)YieldShield" 🛡️
Dynamic Market Structure
Analysis of Turning Points
Fibonacci Linear
Regression Multi-timeframe
Multi-Level Candle Bias
Tracker
Auto Support and
Resistance Trend Lines
All Support and
Resistance Levels
この ShieldedTrend インジケーターは、広く使われている2つの取引手法のスマートな組み合わせに基づいています: 平均足ローソク足 📊 と 指数移動平均 (EMA) 📈。以下はステップバイステップのロジックです:
1️⃣ 基本: 修正された平均足ローソク足
平均足ローソク足は、伝統的なローソク足のノイズを除去するために平滑化されたバージョンです。元の計算は価格の平均を使用しますが、 ShieldedTrend は2つの重要な方法でそれを修正しています:
- 平均足の終値:
実際のローソク足の4つの主要価格の平均として計算されます:
(始値 + 高値 + 安値 + 終値) / 4 🔄。 - 平均足の始値:
実際の価格から直接取るのではなく、前の平均足ローソク足の始値と終値の平均です。
これにより、シャープな変動を除去し、トレンドをより明確にする 自然な「平滑化」効果 が生まれます。
2️⃣ EMAによる平滑化
ShieldedTrend は、平均足ローソク足の両方の要素に 指数移動平均 (EMA) を適用します:
- 平滑化された始値ライン:
平均足の始値に適用されたEMA。 - 平滑化された終値ライン:
平均足の終値に適用されたEMA。
EMAは最近のデータにより重みを置くため、インジケーターは トレンドの変化に素早く反応 しつつ、平滑性を維持します。
3️⃣ 「保護ゾーン」(シールド) 🛡️
2つのライン(平滑化された始値と終値)の間の色付き領域は バッファまたは確認ゾーンとして機能します:
- ゾーンの幅:
2つのラインの差に依存します。 -
- 広い領域 = 強いトレンド(ラインが離れている) 💪。
- 狭い領域 = 迷いまたは弱いトレンド 🤔。
4️⃣ 統合された取引ロジック
- トレンドシグナル:
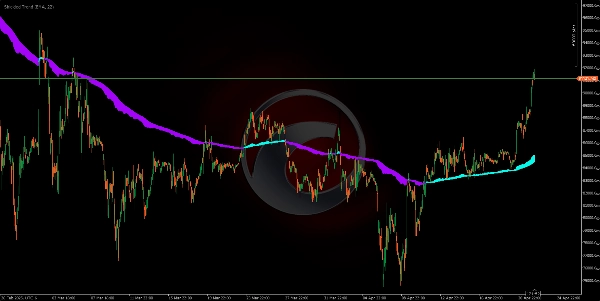
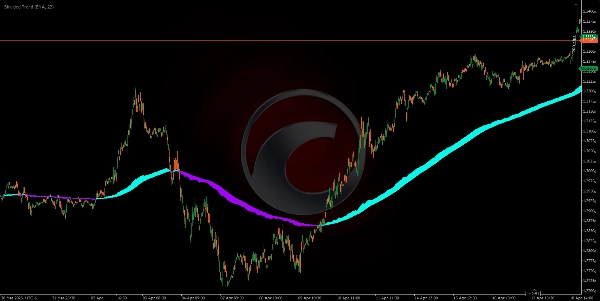
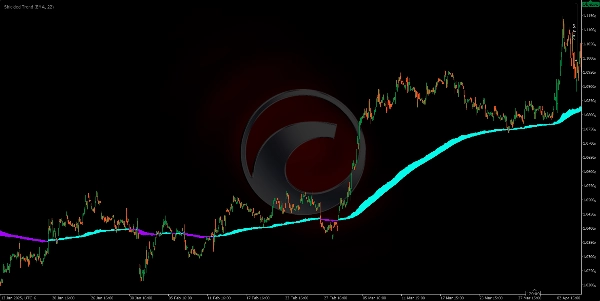
色の変化は潜在的な反転を示します(例:シアンから紫 = 下落トレンドの開始の可能性)🔵🟣。 - トレンドの強さ:
色付き領域の幅は 信頼度フィルターとして機能します: -
- 領域が十分に広い場合のみ取引する (乱高下する市場を避ける) ✅。
- 誤った動きに対する保護:
もし領域が突然狭くなると、色がまだ変わっていなくても現在のトレンドが勢いを失っている可能性を示唆します ⚠。
🌟 なぜ効果があるのか?
- 平均足 + EMA: 価格を2回平滑化(ローソク足 + 移動平均)し、 90%のノイズ を除去します 🎯。
- 保護ゾーン: 不明瞭な市場での取引を避け、失敗取引を減らします 📉➡️📈。
- 視覚的アプローチ: 色と領域の組み合わせにより、 初心者トレーダー でもパターンを素早く見つけやすくなっています ⚡。
概要
The indicator applies EMA smoothing to both the Heikin-Ashi open and close lines, enabling quick reaction to trend changes while maintaining smoothness. The area between these two smoothed lines forms a "Protection Zone" or shield, which acts as a buffer and confirmation zone. The width of this zone indicates trend strength: a wide zone signals a strong trend, while a narrow zone suggests indecision or a weak trend.
ShieldedTrend’s integrated trading logic uses color changes to signal potential trend reversals and the zone width as a confidence filter to avoid trading in choppy markets. The indicator helps protect against false moves by signaling when trend momentum is weakening even before a color change occurs. Its visual design facilitates quick pattern recognition, making it accessible for traders of all experience levels.