🚀 Oltre 10.000 trader utilizzano già i nostri indicatori TOP 🏆 …e la community continua a crescere!
Scopri perché i professionisti ci scelgono – gli strumenti più potenti di cTrader (indicatori + algoritmi + cBots) ti stanno aspettando.
👉 Ottieni tutti i nostri sistemi TOP qui:
Indicatori Pinescriptlabs Store: cBots Pinescriptlabs Store : (cBot) Gold & BTC BreakoutSession Pivots(nuovo)
Advanced Market Structure: Bos, Choch, SwinLevels, Order Blocks, Market Structure & Liquidity Finder (Nuovo)
Proiezione della Liquidità del Prezzo ZigZag
Algoritmo Intelligente di Trailing (nuovo)
Mappa di Liquidazione della Leva
Previsione Basata su Linreg & ATR
Supporto SmartTrend &
Resistenza
Linee
Sistema di Breakout del Canale
Analisi
Dinamica
della Struttura di Mercato
dei
Punti
di Inversione
Regressione
Lineare
Fibonacci
Multi-timeframe
Proiezione del Flusso di Mercato
Gradiente di Tendenza Dinamico
Tracker
Multi-Livello
di Bias delle Candele
Tracker
Supporto
e Resistenza
Automatici
Linee di Tendenza
Linee
Tutti
i Livelli di
Supporto e Resistenza
Livelli
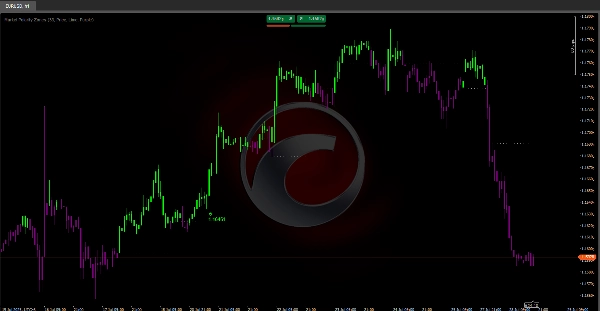
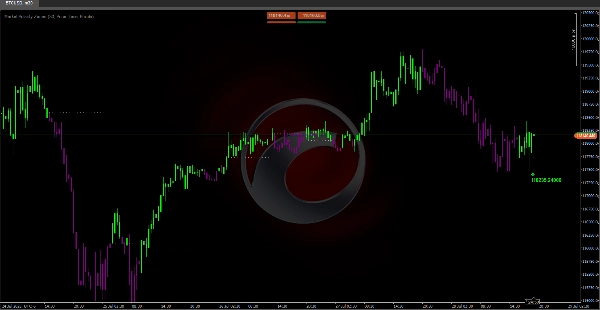
Zone di Polarità di Mercato 📊
Cosa fa questo algoritmo?
Zone di Polarità di Mercato è un indicatore avanzato che semplifica l'analisi del mercato identificando automaticamente fasi rialziste 🚀 o ribassiste 🐻 e segnando i livelli chiave dove sono probabili inversioni di tendenza.
Ideale per:
- Trader di price action
- Trader swing
- Scalper,...che hanno bisogno di individuare rapidamente la direzione del mercato e punti di entrata/uscita precisi.
Come funziona la logica?
L'algoritmo utilizza due Hull Moving Averages (HMA) con periodi diversi per rilevare cambiamenti di momentum e imposta livelli dinamici come segue:
- Rileva i crossover delle HMA per identificare i cambiamenti di tendenza.
- Imposta livelli automatici:
-
- Crossover rialzista → Segna il minimo come livello di supporto
- Crossover ribassista → Segna il massimo come livello di resistenza
- Mantiene il livello attivo fino a quando non si verifica un nuovo crossover.
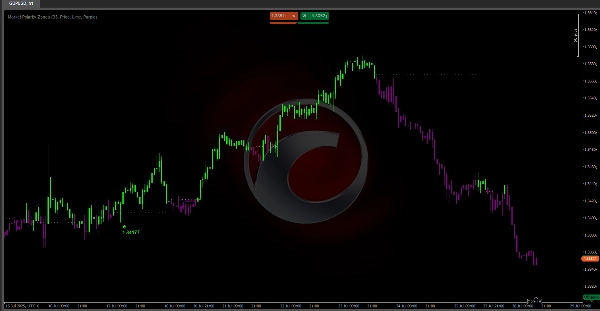
Cosa vedrai sul tuo grafico:
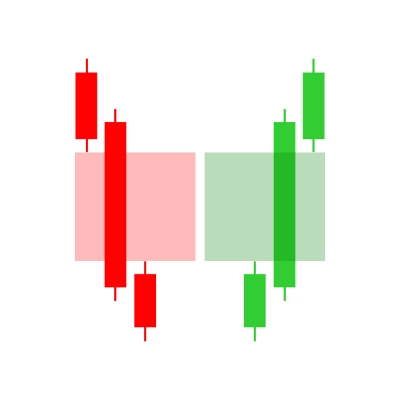
🎨 Sistema di colori intuitivo:
- Candele verdi 🟢: Prezzo sopra il livello (zona rialzista – cerca acquisti)
- Candele viola 🟣: Prezzo sotto il livello (zona ribassista – cerca vendite)
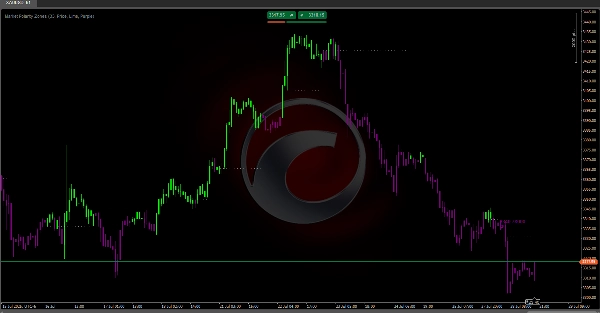
📉 Linee di livello dinamiche:
- Linee orizzontali tratteggiate che segnano il livello di polarità attivo
- Si estendono automaticamente finché il livello rimane valido
- Appaiono solo quando il livello si stabilizza
⚠️ Avvisi di inversione:
Le etichette a freccia appaiono quando si formano pattern specifici:
- 🔻 Inversione ribassista (etichetta viola):
-
- Pattern: Il prezzo sale → fallisce → scende sotto il livello
- Significato: Pressione rialzista in diminuzione, possibile spostamento verso zona ribassista
- 🔺 Inversione rialzista (etichetta verde):
-
- Pattern: Il prezzo scende → rimbalza → sale sopra il livello
- Significato: Acquirenti che difendono il livello, possibile spostamento verso zona rialzista
ℹ️ Informazioni sulle etichette:
- "Prezzo": Mostra il punto esatto di fallimento del breakout – usalo per stop precisi o per identificare resistenze/supporti chiave.
- "Volume": Somma del volume degli ultimi 3 barre – conferma se l'inversione ha vera partecipazione di mercato.
Impostazioni consigliate:
- Lunghezza: 33 (default) – Funziona bene per la maggior parte dei mercati
- Dati Etichetta: "Prezzo" per precisione del livello, "Volume" per conferma
- Colori: Mantieni Lime/Viola per il miglior contrasto visivo 🎨


![Logo di "Trend Angle Indicator [Iridio Capital]"](https://cdn.ctrader.com/image/webp/28a98496-3412-4fea-82eb-be3347bdd6f1_27612)